Prometheus from A to Y

What is Prometheus?
Prometheus is a monitoring solution created by SoundCloud in 2012 and open-sourced in 2015. In 2016, Prometheus became the second project to join the Cloud Native Computing Foundation (the first being Kubernetes).
Prometheus is designed to monitor metrics from applications or servers.
It consists of 3 parts:
- The query engine to retrieve metrics from exporters;
- The Time Series Database (TSDB) that stores short-term data;
- The web service that allows querying the database.

It also includes an alerting tool that reacts when a metric exceeds a threshold considered critical.
This stack does not use agents per se, Prometheus relies on exporters: microservices that retrieve information from the host and expose it on a web page in a format specific to Prometheus.
Example:
# HELP node_disk_written_bytes_total The total number of bytes written successfully.
# TYPE node_disk_written_bytes_total counter
node_disk_written_bytes_total{device="sda"} 1.71447477248e+11
node_disk_written_bytes_total{device="sr0"} 0
Example use case: To monitor a Linux system and the Docker containers running on it, you need to install a first exporter for system metrics and a second one for the Docker daemon. One (or more) Prometheus server can then query these two exporters to retrieve the data.
Prometheus retrieves the data by querying the exporters itself, it works in a Pull mode rather than Push!
The Prometheus database has an index based on time (like InfluxDB) but also on sets of key-value pairs: labels. Labels define the context of an information: by whom? which application? which machine?
The Prometheus database does not respond to SQL, but to PromQL: a language adapted to this notion of labels.
It is presented in the following format: METRIC_NAME{LABEL1="VALUE",LABEL2="value"}[duration]
- In SQL:
SELECT node_memory_MemFree_bytes WHERE instance IS "nodeexporter:9100" AND WHERE TIME >= Dateadd(MINUTE, -5, GETDATE()) - In PromQL:
node_memory_MemFree_bytes{instance="nodeexporter:9100"}[5m]
Advantages and Disadvantages
Advantages:
- Can integrate with many solutions through third-party exporters (+ exporters are easy to create).
- Manages alerts* itself.
- Possible to have multiple Prometheus instances aggregated by a central Prometheus (e.g., one Prometheus per zone/DC).
Disadvantages:
- No cluster concept (aggregation does not create HA).
- Not suitable for storing textual data (only metrics).
- Limited security (only TLS and ‘basic_auth’ authentication).
Prometheus Installation
Prometheus is available in most repositories:
apt install prometheus
apk add prometheus
yum install prometheus
It is also possible to retrieve a recent version from the Release tab of the official GitHub repository.
By starting the Prometheus service, a web server will be accessible on port 9090.
Info
I will be using the domain prometheus.home which is managed by my local DHCP/DNS. The usage of a domain name is optional but will be essential in an upcoming section (TLS support).
My Prometheus server uses the following address: http://server.prometheus.home:9090
Configure Prometheus
If you install the package version, you will have a configuration file available at this location: /etc/prometheus/config.yml
global:
  scrape_interval: 15s # Set the scrape interval to every 15 seconds. Default is every 1 minute.
  evaluation_interval: 15s # Evaluate rules every 15 seconds. The default is every 1 minute.

alerting:
  alertmanagers:
    - static_configs:
        - targets:
          # - alertmanager:9093

# Load rules once and periodically evaluate them according to the global 'evaluation_interval'.
rule_files:
  # - "first_rules.yml"
  # - "second_rules.yml"

# A scrape configuration containing exactly one endpoint to scrape:
# Here it's Prometheus itself.
scrape_configs:
  # The job name is added as a label `job=<job_name>` to any timeseries scraped from this config.
  - job_name: "prometheus"
    static_configs:
      - targets: ["localhost:9090"]
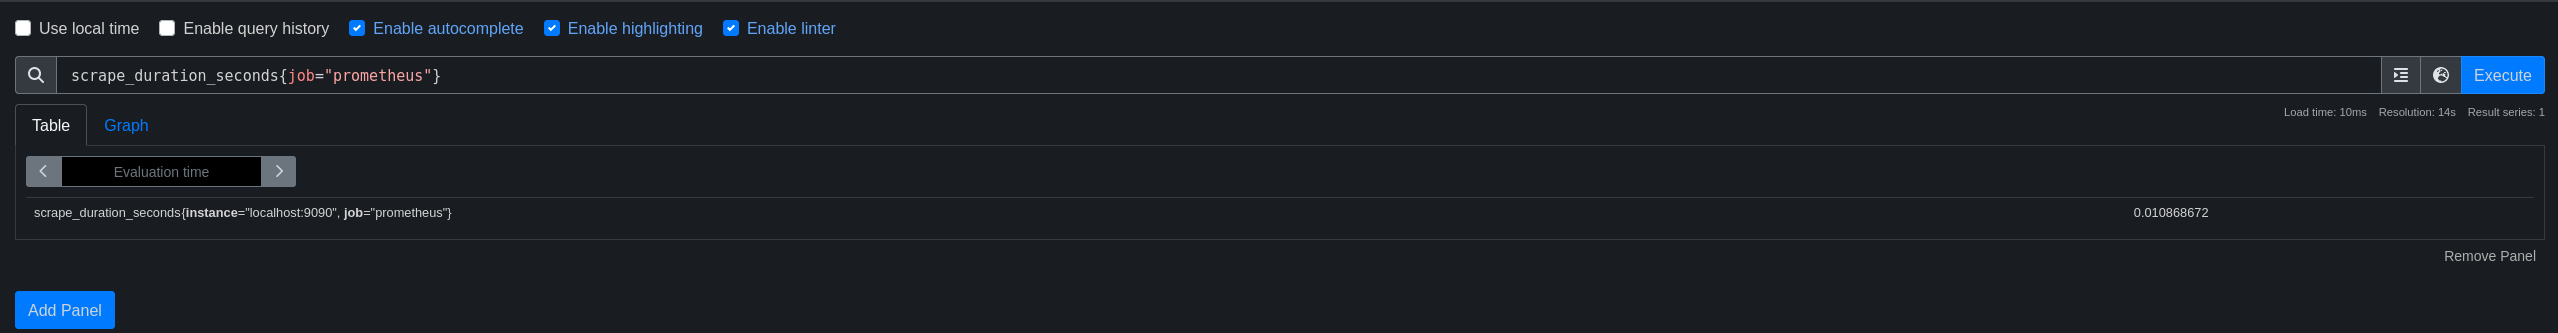
At this stage, the part that interests us is scrape_config because this is where we will add the exporters.
We can already see that Prometheus monitors itself. We can start writing our first PromQL queries.
Info
For information, here are the characteristics of my installation:
- OS: Alpine 3.17.1
- Prometheus: 2.47.1
- NodeExporter: 1.6.1 (to be seen later)
- AlertManager: 0.26.0 (to be seen later)
- PushGateway 1.6.2 (to be seen later)
If you haven’t already, you need to start the Prometheus service.
service prometheus start # AlpineOS
systemctl start prometheus
To view Prometheus metrics, simply make a request to the following path: /metrics.
curl http://server.prometheus.home:9090/metrics -s | tail -n 5
# HELP promhttp_metric_handler_requests_total Total number of scrapes by HTTP status code.
# TYPE promhttp_metric_handler_requests_total counter
promhttp_metric_handler_requests_total{code="200"} 20
promhttp_metric_handler_requests_total{code="500"} 0
promhttp_metric_handler_requests_total{code="503"} 0
From the web interface, it is possible to display the available metrics and query them.
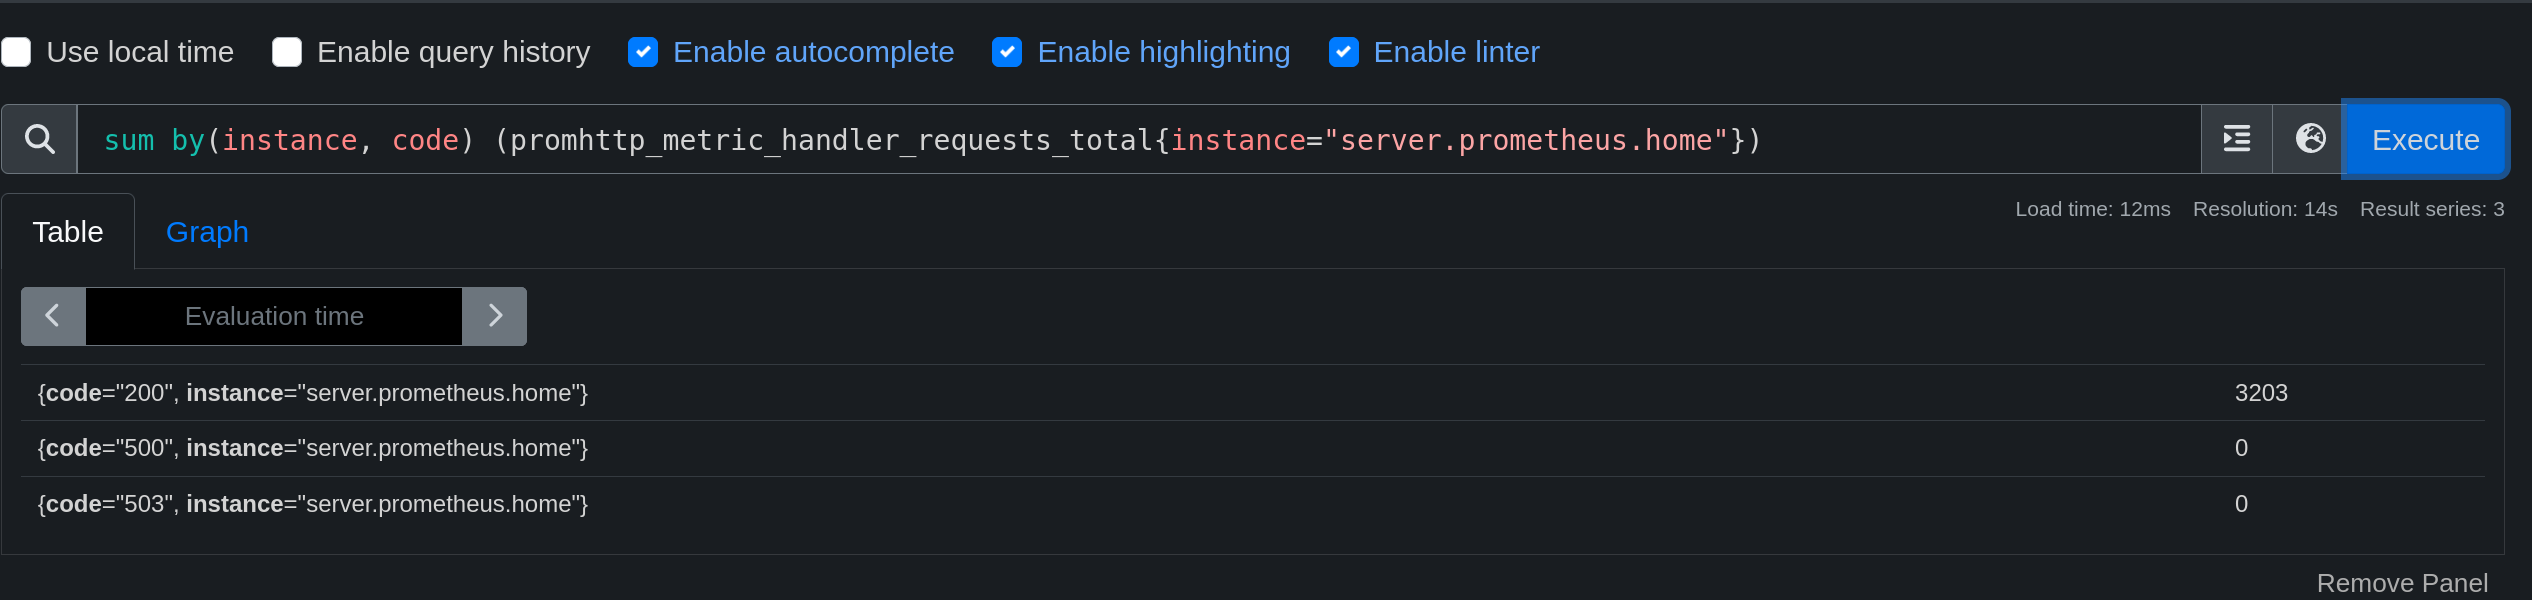
Info
There is a utility called promtool that allows you to test the Prometheus configuration and make PromQL queries.
Example of a query using PromTool:
promtool query instant http://localhost:9090 'prometheus_http_requests_total{code="200", handler="/graph", instance="localhost:9090", job="prometheus"}'

 prometheus_http_requests_total{code="200", handler="/graph", instance="localhost:9090", job="prometheus"} => 2 @[1696592187.208]
PromQL
What is PromQL?
Before we continue adding exporters, let’s take a quick tour of PromQL.
PromQL, or Prometheus Query Language, is a query language specifically designed to query, analyze, and extract data from a time series database managed by Prometheus. Prometheus is a widely used open-source monitoring system that collects and stores performance metrics as well as time series data from various sources such as servers, applications, services, and more.
PromQL allows users to formulate complex queries to extract useful information from the metrics collected by Prometheus. Here are some of the key concepts and features of PromQL:
Time series: Metrics in Prometheus are stored as time series, which are streams of data points indexed by a set of labels. For example, a time series could represent the CPU usage of a server at a given moment.
Metric selection: You can use PromQL to select specific metrics based on criteria such as labels, metric names, etc. For example, you can query all metrics related to the CPU of a particular instance by specifying its architecture and/or name.
Aggregation: PromQL supports aggregation operations such as sum, average, maximum, minimum, etc. You can aggregate data over a given time period to obtain statistics.
Mathematical operations: You can perform mathematical operations on metrics, allowing you to create new time series by combining or transforming existing data.
Creating a Query
A PromQL query can look like this:
node_network_transmit_bytes_total
This rule selects all metrics with the name node_network_transmit_bytes_total, regardless of its source, context, or labels. This will give us a list of responses from all machines monitored by Prometheus.
We can then add a filter to specify the context of the metric:
node_network_transmit_bytes_total{instance="laptop.prometheus.home", device="wlp46s0"}
We are now targeting the laptop.prometheus.home instance and the wlp46s0 network card. We get a single response since these previous filters target a specific machine and card.
Targeting all metrics with a specific label
It is possible to query all metrics with a specific label. For example, I want to retrieve all metrics with the instance label set to laptop.prometheus.home.
{instance="laptop.prometheus.home"}
Regex and negation
A very important feature of PromQL is the integration of regex. It is possible to query metrics whose label matches a regular expression by adding a tilde (~) before the value.
apt_upgrades_pending{arch=~"^a[a-z]+"}
Without using a regex, we can exclude a label with an exclamation point (!).
apt_upgrades_pending{arch!="i386"}
We can even combine the two to exclude a regex!
apt_upgrades_pending{arch!~"i[0-9]{3}"}
Going Back in Time

Now we are able to retrieve metrics, but we can also retrieve older metrics using the offset keyword.
node_network_transmit_bytes_total{instance="laptop.prometheus.home", device="wlp46s0"} offset 5m
We obtain the metrics of the network card wlp46s0 from the machine laptop.prometheus.home dating back 5 minutes.
I can also retrieve all the values from the past 5 minutes.
node_network_transmit_bytes_total{instance="laptop.prometheus.home", device="wlp46s0"}[5m]
The answer is as follows:
87769521 @1696594464.484
87836251 @1696594479.484
87957452 @1696594494.484
88027802 @1696594509.484
88394773 @1696594524.484
88861454 @1696594539.484
90392775 @1696594554.484
91519657 @1696594569.484
(I have shortened the result a bit.)
These values are separated by @ and are in the format value @ timestamp.
But this metric is not very meaningful since it is obvious that the value increases over time.
It is then possible to perform mathematical operations on metrics and in particular to generate a graph using the rate function, which calculates the growth rate of a metric.
rate(node_network_transmit_bytes_total{instance="laptop.prometheus.home", device="wlp46s0"}[5m])
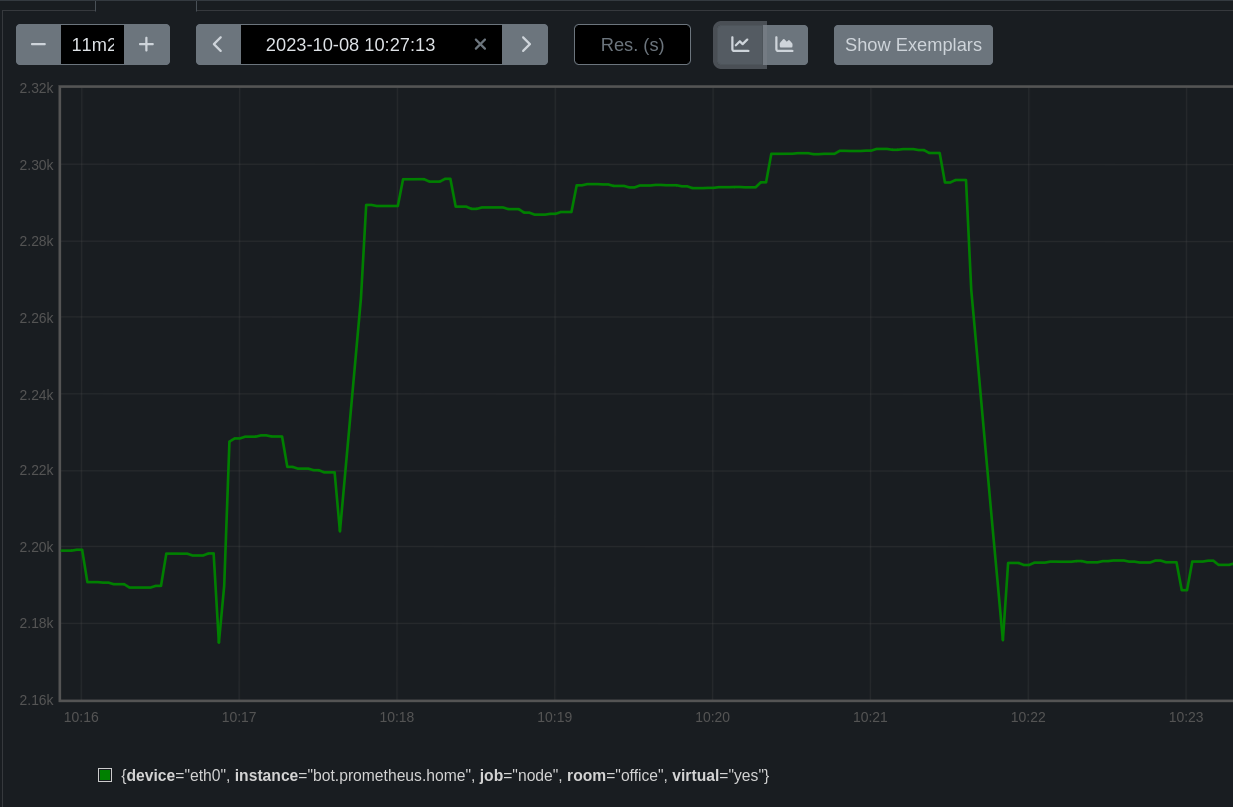
In this case, we convert a counter value to a gauge. We will see how this works in the next section.
Metric Types
There are 4 types of metrics in Prometheus:
- Counter: a value that increases over time. Example: the number of HTTP 200 requests on a web server, which cannot decrease.
- Gauge: a value that can increase or decrease over time. Example: the amount of memory used by a process.
- Histogram: a value that can increase or decrease over time, but can also store values in buckets (intervals). Example: the number of HTTP 200 requests on a web server, but with time intervals (0-100ms, 100-200ms, etc).
- Summary: similar to Histogram but does not require knowing the intervals in advance.
It is possible to convert from one type to another by applying a function like rate (seen just above, which allows creating a curve from a growth rate)
Our first exporter (NodeExporter)
What is NodeExporter?
We have a Prometheus that retrieves metrics from an exporter (itself) at the address: 127.0.0.1:9090.
Now we will be able to add a more relevant exporter that will retrieve metrics from our system.
Usually, the first exporter to install on a machine is the NodeExporter.
I won’t do it for every exporter presented, but here are the metrics available on the NodeExporter:
Metrics
- Processor:
- node_cpu_seconds_total: Total time spent by the processor in user, system, and idle mode.
- node_cpu_usage_seconds_total: Total time spent by the processor in user, system, and idle mode, expressed as a percentage.
- node_cpu_frequency_average: Average processor frequency.
- node_cpu_temperature: Processor temperature.
- Memory:
- node_memory_MemTotal_bytes: Total amount of available physical memory.
- node_memory_MemFree_bytes: Amount of free physical memory.
- node_memory_Buffers_bytes: Amount of memory used for buffers.
- node_memory_Cached_bytes: Amount of memory used for cache.
- node_memory_SwapTotal_bytes: Total amount of available virtual memory.
- node_memory_SwapFree_bytes: Amount of free virtual memory.
- Disk:
- node_disk_io_time_seconds_total: Total time spent by disks in read and write operations.
- node_disk_read_bytes_total: Total amount of data read by disks.
- node_disk_write_bytes_total: Total amount of data written by disks.
- node_disk_reads_total: Total number of disk reads.
- node_disk_writes_total: Total number of disk writes.
- Network:
- node_network_receive_bytes_total: Total amount of data received by the network.
- node_network_transmit_bytes_total: Total amount of data transmitted by the network.
- node_network_receive_packets_total: Total number of packets received by the network.
- node_network_transmit_packets_total: Total number of packets transmitted by the network.
- Operating System:
- node_kernel_version: Linux kernel version.
- node_os_name: OS name.
- node_os_family: OS family.
- node_os_arch: OS architecture.
- Hardware:
- node_machine_type: Machine type.
- node_cpu_model: Processor model.
- node_cpu_cores: Number of processor cores.
- node_cpu_threads: Number of processor threads.
- node_disk_model: Disk model.
- node_disk_size_bytes: Disk size.
- node_memory_device: Memory device.
NodeExporter Installation
Installation on Linux
To install NodeExporter, there are several methods. The simplest one is to use the official package:
apt install prometheus-node-exporter
apk add prometheus-node-exporter
yum install prometheus-node-exporter
Tip
Installation with Docker
Most exporters are also available as Docker containers. This is the case for NodeExporter:
docker run -d \
  --net="host" \
  --pid="host" \
  -v "/:/host:ro,rslave" \
  quay.io/prometheus/node-exporter:latest \
  --path.rootfs=/host
Manual Installation
It is also possible to retrieve a recent version from the Release tab of the official GitHub repository.
Installation on Windows
Windows does not have the same program as its Linux counterparts. It is developed by the community but does not have the same metric names: Windows Exporter.
NodeExporter Configuration
If the service is not started automatically, it needs to be started:
service prometheus-node-exporter start # AlpineOS
systemctl start prometheus-node-exporter
This service will open a port on 9100. We will be able to see our metrics at the following address: http://server.prometheus.home:9100/metrics (assuming that this exporter is on the same server as Prometheus).
We can see that the metrics are present, but now we need to add them to our configuration file /etc/prometheus/config.yml so that Prometheus takes them into account.
global:
  scrape_interval: 15s
  evaluation_interval: 15s

alerting:
  alertmanagers:
    - static_configs:
        - targets:
          # - alertmanager:9093
rule_files:
  # - "first_rules.yml"
  # - "second_rules.yml"

scrape_configs:

  - job_name: "prometheus"
    static_configs:
      - targets: ["localhost:9090"]

  - job_name: "node"
    static_configs:
      - targets: ["localhost:9100"]
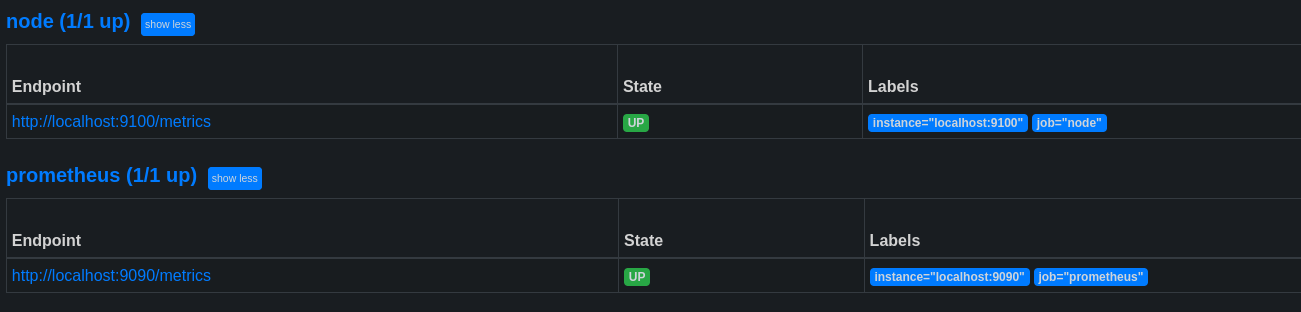
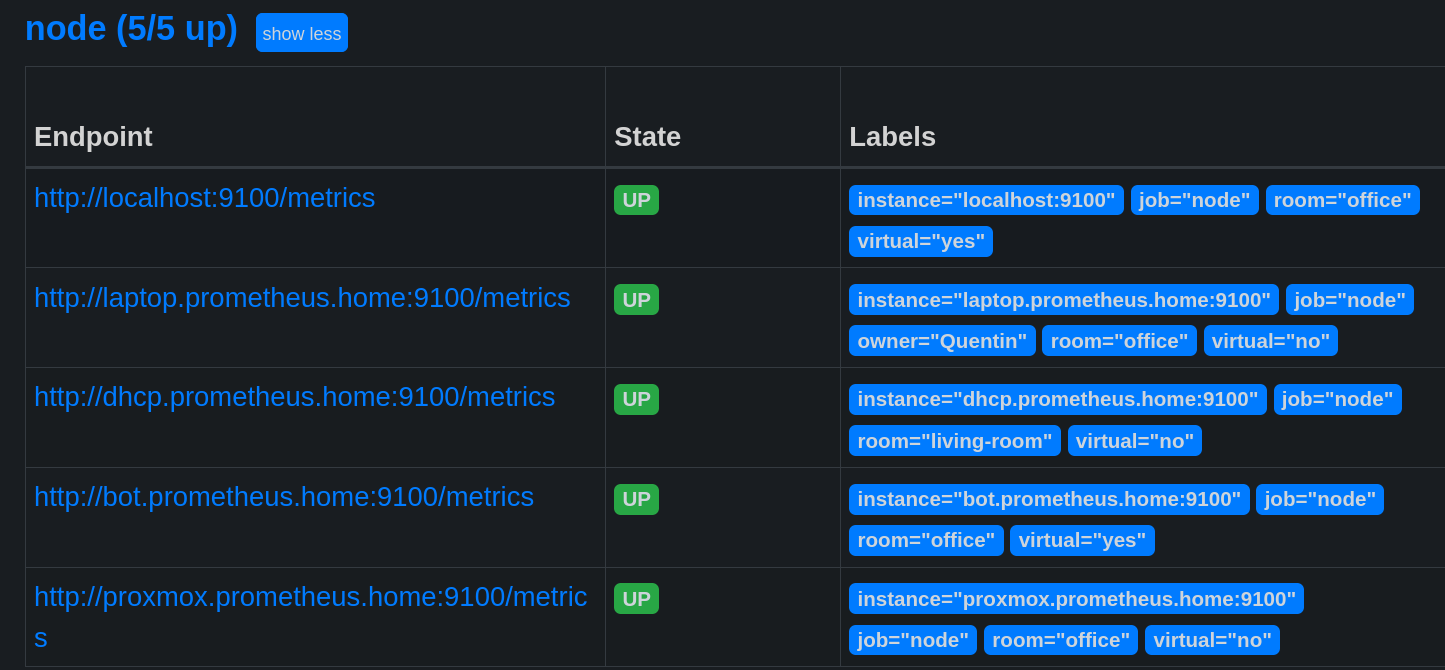
After reloading the Prometheus service, we can see that the NodeExporter metrics are present on the Status->Targets page (or http://server.prometheus.home:9090/targets).
Now let’s try a query to see if everything is working fine:
round((node_filesystem_size_bytes{device="/dev/vg0/lv_root", instance="localhost:9100"} - node_filesystem_avail_bytes{device="/dev/vg0/lv_root", instance="localhost:9100"}) / node_filesystem_size_bytes{device="/dev/vg0/lv_root", instance="localhost:9100"} * 100)
This query calculates the percentage used on the volume /dev/vg0/lv_root. (total size - available size) / total size * 100, rounded to the nearest integer.
We specify the instance localhost:9100 and the device /dev/vg0/lv_root to retrieve metrics from the correct volume. This means that we can view information from another machine by modifying the value of “instance” to the corresponding value of another exporter configured in Prometheus.
I will now add another exporter to retrieve metrics from my laptop.
  - job_name: "node"
    static_configs:
      - targets: ["localhost:9100"]
      - targets: ["laptop.prometheus.home:9100"]
        labels:
          owner: "Quentin"
          room: "office"
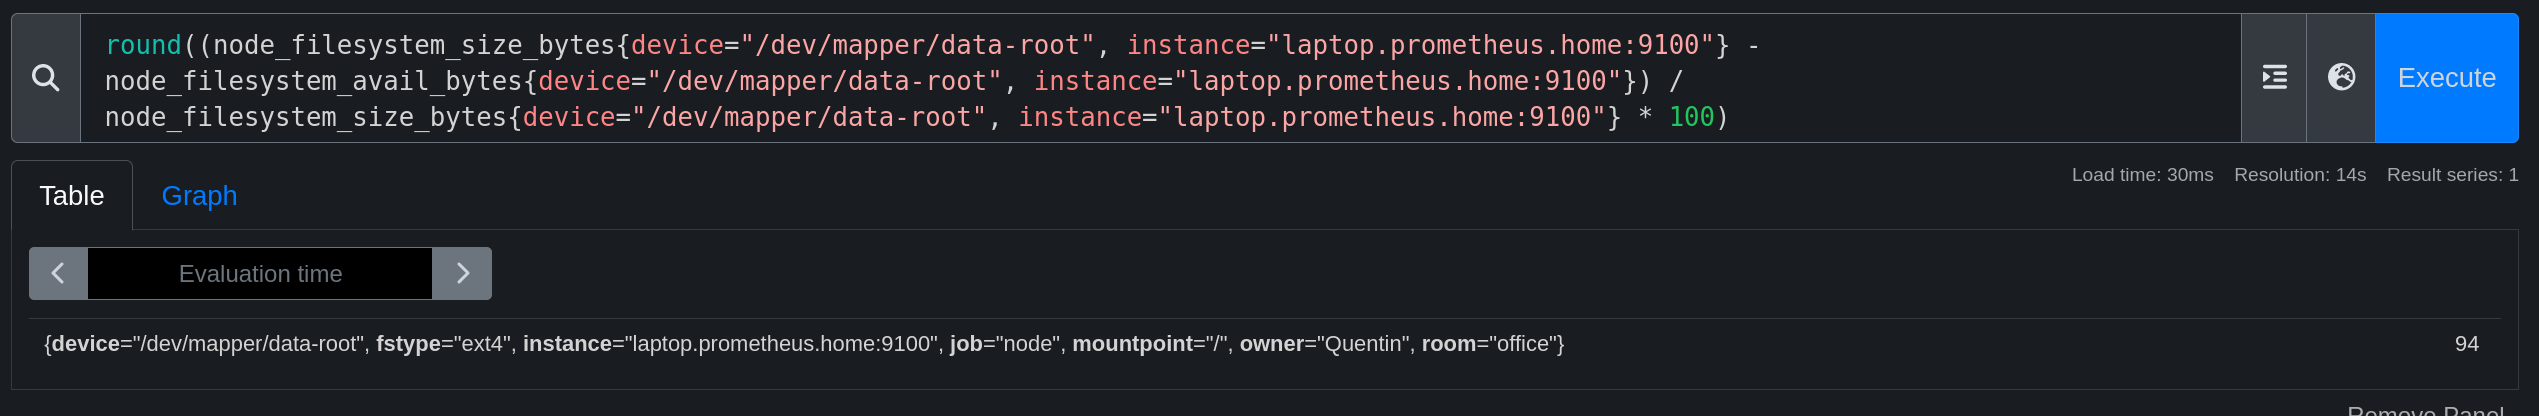
➜ df -h | grep "data-root"
/dev/mapper/data-root 460G 408G 29G 94% /
And as you have seen, it is possible to add labels to specify the context of the metric. These labels will be useful in our PromQL.
I will expand our playground by adding other exporters.
For example: ((node_network_transmit_bytes_total / node_network_receive_bytes_total) > 0) and {room="office", device!~"(tinc.*)|lo|(tap|tun).*|veth.*|fw.*|br"} allows to retrieve the ratio of transmitted data compared to received data from all machines present in the office, excluding interfaces of type tinc, lo, tap, tun, veth, fw, and br.
Just like in SQL, it is possible to use group functions (sum, avg, min, max, count, etc) and mathematical functions (round, floor, ceil, etc).
Relabeling
Relabeling is a feature of Prometheus that allows modifying the labels of a metric without modifying the exporter itself.
Its operation is simple:
- Take an existing label (source_label);
- Apply a transformation to it (deletion, replacement, addition, etc.);
- Store the result in a new label (target_label).
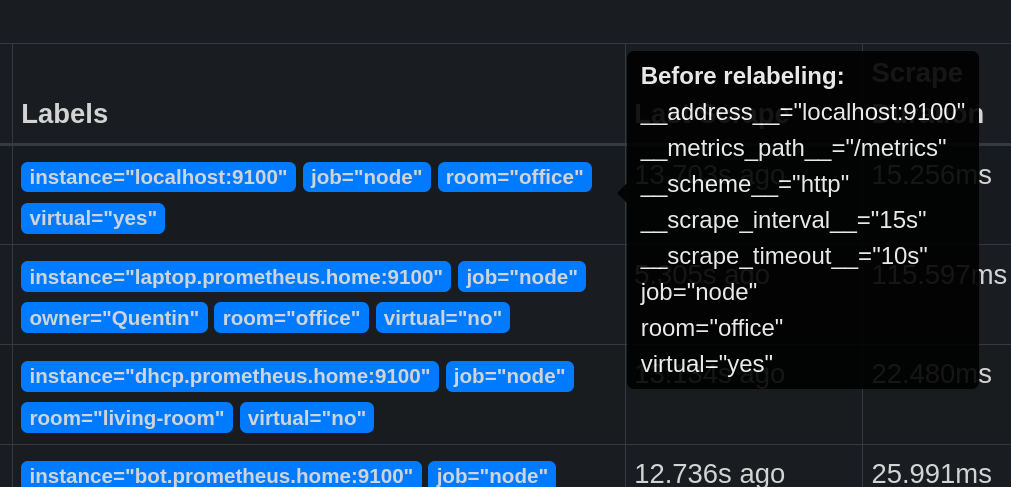
There are also meta-labels that provide access to certain exporter parameters.
For example, __address__ contains the address of the exporter (which will create the instance label), __scheme__ contains the protocol used (http or https), etc.
Relabeling can be used to hide the port used by the exporter.
  - job_name: "node"
    static_configs:
# ...
      - targets: ["bot.prometheus.home:9100"]
        labels:
          room: "office"
          virtual: "yes"
      - targets: ["proxmox.prometheus.home:9100"]
        labels:
          room: "office"
          virtual: "no"
    relabel_configs:
      - source_labels: [__address__]
        regex: '(.*):[0-9]+'
        replacement: '${1}'
        target_label: instance
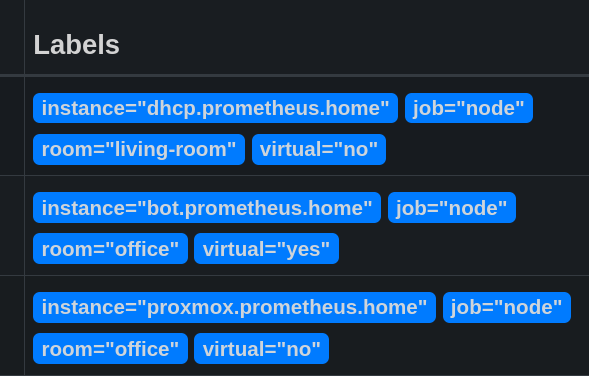
This modification is basic but already allows us to simplify our queries when we want to target a specific machine. After adding other exporters on the same machine, the instance will be the same for all exporters present on it.
It is also possible to modify the name of a metric:
- job_name: "node"
static_configs:
# ...
- targets: ["bot.prometheus.home:9100"]
labels:
room: "office"
virtual: "yes"
- targets: ["proxmox.prometheus.home:9100"]
labels:
room: "office"
virtual: "no"
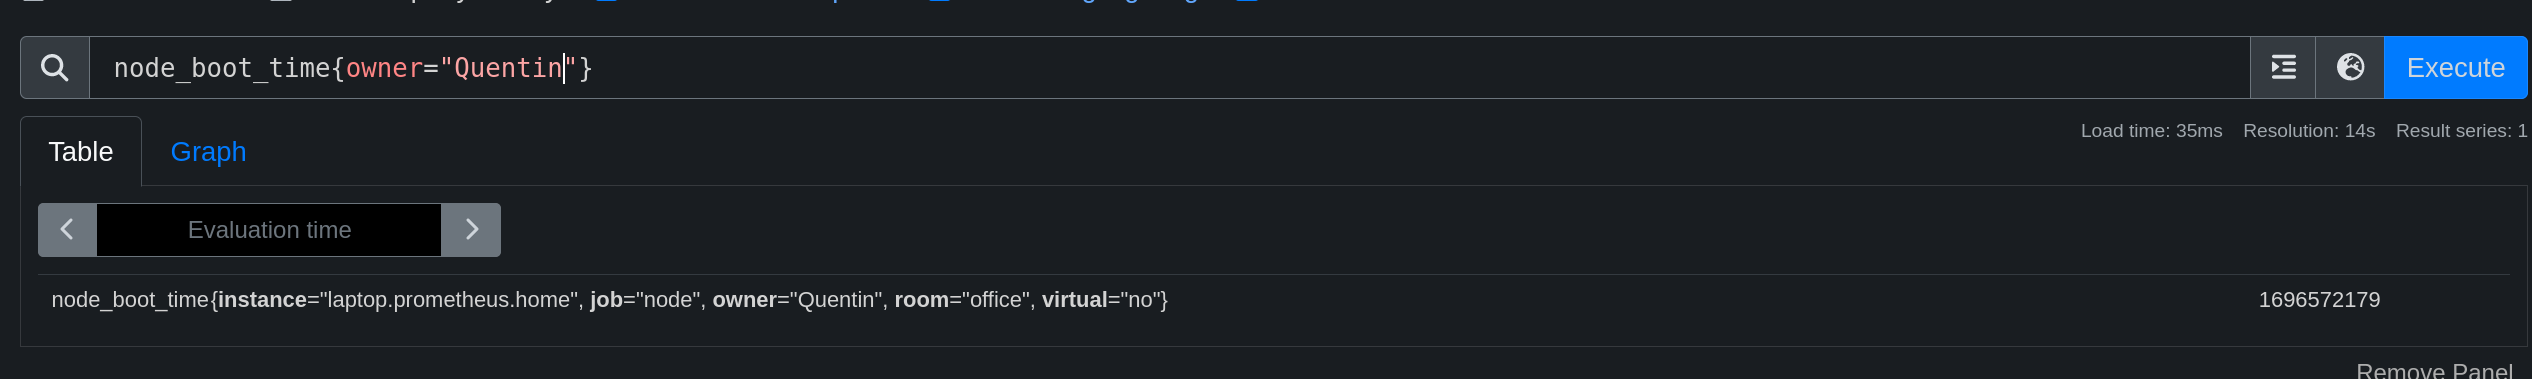
metric_relabel_configs:
- source_labels: ['__name__']
regex: 'node_boot_time_seconds'
target_label: '__name__'
replacement: 'node_boot_time'
With this configuration, I search for all metrics with the __name__ label as node_boot_time_seconds and replace it with node_boot_time.
Monitoring a port/site/IP (Blackbox Exporter)
So far, we have only monitored metrics from hosts on which we had access to install an exporter. But how do we monitor a remote entity on which we don’t have control?
The solution is as follows: an exporter doesn’t necessarily need to be on the host being monitored. The MySQL exporter can be on a dedicated server for monitoring and monitor a remote database.
There is an exporter available for monitoring a port, a website, or an IP: Blackbox Exporter.
apt install prometheus-blackbox-exporter
apk add prometheus-blackbox-exporter
yum install prometheus-blackbox-exporter
The configuration file is as follows: /etc/prometheus/blackbox.yml.
modules:
  http_2xx:
    prober: http
    http:
      preferred_ip_protocol: "ip4"
  http_post_2xx:
    prober: http
    http:
      method: POST
  tcp_connect:
    prober: tcp
  pop3s_banner:
    prober: tcp
    tcp:
      query_response:
      - expect: "^+OK"
      tls: true
      tls_config:
        insecure_skip_verify: false
  grpc:
    prober: grpc
    grpc:
      tls: true
      preferred_ip_protocol: "ip4"
  grpc_plain:
    prober: grpc
    grpc:
      tls: false
      service: "service1"
  ssh_banner:
    prober: tcp
    tcp:
      query_response:
      - expect: "^SSH-2.0-"
      - send: "SSH-2.0-blackbox-ssh-check"
  irc_banner:
    prober: tcp
    tcp:
      query_response:
      - send: "NICK prober"
      - send: "USER prober prober prober :prober"
      - expect: "PING :([^ ]+)"
        send: "PONG ${1}"
      - expect: "^:[^ ]+ 001"
  icmp:
    prober: icmp
  icmp_ttl5:
    prober: icmp
    timeout: 5s
    icmp:
      ttl: 5
It is not necessary to modify the default configuration. These will be parameters to specify in the request.
curl "http://server.prometheus.home:9115/probe?target=https://une-tasse-de.cafe&module=http_2xx" -s | tail -n 12
# HELP probe_ssl_last_chain_expiry_timestamp_seconds Returns last SSL chain expiry in timestamp
# TYPE probe_ssl_last_chain_expiry_timestamp_seconds gauge
probe_ssl_last_chain_expiry_timestamp_seconds 1.703592167e+09
# HELP probe_ssl_last_chain_info Contains SSL leaf certificate information
# TYPE probe_ssl_last_chain_info gauge
probe_ssl_last_chain_info{fingerprint_sha256="1ad4423a139029b08944fe9b42206cc07bb1b482b959d3908c93b4e4ccec7ed8",issuer="CN=R3,O=Let's Encrypt,C=US",subject="CN=une-tasse-de.cafe",subjectalternative="une-tasse-de.cafe"} 1
# HELP probe_success Displays whether or not the probe was a success
# TYPE probe_success gauge
probe_success 1
# HELP probe_tls_version_info Returns the TLS version used or NaN when unknown
# TYPE probe_tls_version_info gauge
probe_tls_version_info{version="TLS 1.3"} 1
The parameters used are as follows:
- module: the module to use (defined in the configuration file)
- target: the address to monitor
Another example for pinging an IP address: you need to use the icmp module and specify the IP address in the target parameter.
curl 'http://server.prometheus.home:9115/probe?target=1.1.1.1&module=icmp' -s | tail -n 6
# HELP probe_ip_protocol Specifies whether probe ip protocol is IP4 or IP6
# TYPE probe_ip_protocol gauge
probe_ip_protocol 4
# HELP probe_success Displays whether or not the probe was a success
# TYPE probe_success gauge
probe_success 1
Now we can add this exporter to our Prometheus configuration file by specifying the targets to monitor.
Here is an example configuration that will monitor the following entities:
- The websites https://une-tasse-de.cafe and https://une-pause-cafe.fr.
- The IPs 1.1.1.1, 192.168.1.250, and 192.168.1.400.
- The port 32400 of the host media_server.
  - job_name: 'websites'
    metrics_path: /probe
    params:
      module: [http_2xx]
    static_configs:
      - targets:
        - https://une-tasse-de.cafe
        - https://une-pause-cafe.fr
    relabel_configs:
      - source_labels: [__address__]
        target_label: __param_target
      - source_labels: [__param_target]
          regex: 'http.://(.*)' # remove the http(s) in the instance, otherwise set to (.*) to keep the complete address
          replacement: '${1}'
          target_label: instance
        - target_label: __address__ # Query the blackbox exporter
          replacement: 127.0.0.1:9115

  - job_name: 'icmp'
    metrics_path: /probe
    params:
      module: [icmp]
    static_configs:
      - targets:
        - 1.1.1.1
        - 192.168.1.250
        - 192.168.1.400 # does not exist
    relabel_configs:
      - source_labels: [__address__]
        target_label: __param_target
      - source_labels: [__param_target]
        regex: '(.*)'
        replacement: '${1}'
        target_label: instance
      - target_label: __address__
        replacement: 127.0.0.1:9115

  - job_name: 'tcp_port'
    metrics_path: /probe
    params:
      module: [tcp_connect]
    static_configs:
      - targets:
        - media_server:32400
    relabel_configs:
      - source_labels: [__address__]
        target_label: __param_target
      - target_label: __address__
        replacement: 127.0.0.1:9115
      - source_labels: [__param_target]
        regex: '(.*)'
        target_label: instance
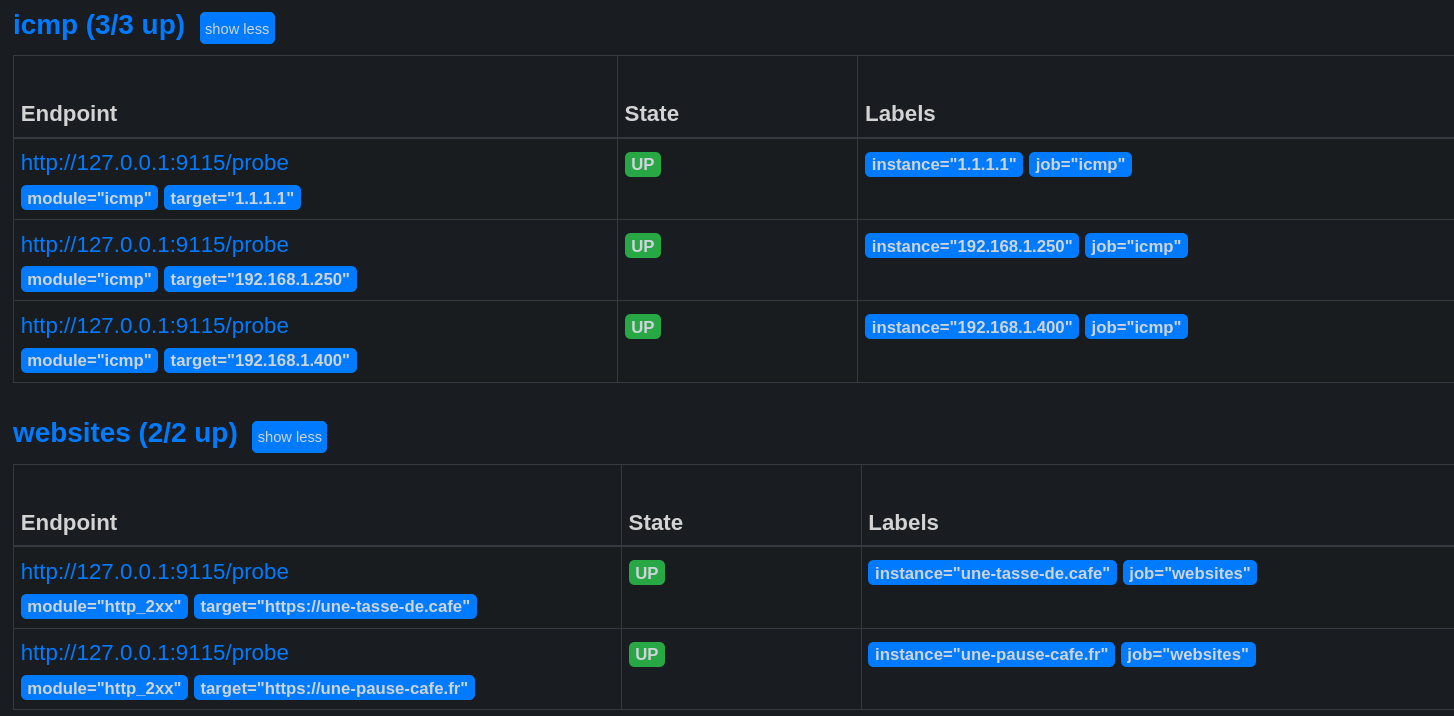
Warning
When we add an exporter, it is assigned an up metric.
This metric indicates whether an exporter is accessible or not, but it does not mean that the monitored host is functional!
For example: the IP 192.168.1.400 does not exist, but the BlackBox exporter is accessible. The up request is OK, but when I request the ping result, it is 0 (meaning the host is not responding).
promtool query instant http://localhost:9090 "up{instance='192.168.1.400'}"
  up{instance="192.168.1.250", job="icmp"} => 1 @[1696577858.881]
promtool query instant http://localhost:9090 "probe_success{instance='192.168.1.400'}"
  probe_success{instance="192.168.1.400", job="icmp"} => 0 @[1696577983.835]
Where to find exporters?
The official Prometheus documentation provides a list of exporters: prometheus.io/docs/instrumenting/exporters/.
The list is quite comprehensive, but you can also find SDKs and examples for developing your own exporters directly on the Prometheus GitHub: github.com/prometheus.
Example of an exporter in Golang
Here is an example of an exporter in Golang that counts the number of IP addresses in the /etc/hosts file. It opens port 9108 and exposes the etc_hosts_ip_count metric at the /metrics endpoint.
Code
package main

import (
	"fmt"
	"io/ioutil"
	"net/http"
	"strings"
	"github.com/prometheus/client_golang/prometheus"
	"github.com/prometheus/client_golang/prometheus/promhttp"
)

func main() {
	ipCount := prometheus.NewGauge(prometheus.GaugeOpts{
		Name: "etc_hosts_ip_count",
		Help: "Nombre d'adresses IP dans le fichier /etc/hosts",
	})

	prometheus.MustRegister(ipCount)
	fileContent, err := ioutil.ReadFile("/etc/hosts")
	if err != nil {
		fmt.Println(err)
	}
	ipCountValue := countIPs(string(fileContent))
	ipCount.Set(float64(ipCountValue))
	http.Handle("/metrics", promhttp.Handler())
	http.HandleFunc("/", func(w http.ResponseWriter, r *http.Request) {
                fmt.Fprintf(w, "Nombre d'adresses IP dans /etc/hosts: %d", ipCountValue)
	})
	fmt.Println("Démarrage du serveur HTTP sur le port :9108")
	fmt.Println(http.ListenAndServe(":9108", nil))
}
func countIPs(content string) int {
	lines := strings.Split(content, "\n")
	ipCount := 0
	for _, line := range lines {
		if strings.TrimSpace(line) == "" || strings.HasPrefix(line, "#") {
			continue
		}
		fields := strings.Fields(line)
		for _, field := range fields {
			if isIPv4(field) || isIPv6(field) {
				ipCount++
			}
		}
	}
	return ipCount
}

func isIPv4(s string) bool {
	parts := strings.Split(s, ".")
	if len(parts) != 4 {
		return false
	}
	for _, part := range parts {
		if len(part) == 0 {
			return false
		}
		for _, c := range part {
			if c < '0' || c > '9' {
				return false
			}
		}
		num := atoi(part)
		if num < 0 || num > 255 {
			return false
		}
	}
	return true
}
func isIPv6(s string) bool {
	return strings.Count(s, ":") >= 2 && strings.Count(s, ":") <= 7
}
func atoi(s string) int {
	n := 0
	for _, c := range s {
		n = n*10 + int(c-'0')
	}
	return n
}
Once the exporter is compiled and running, we add it to Prometheus:
scrape_configs:
  - job_name: "etc_hosts"
    static_configs:
      - targets: ["laptop.prometheus.home:9108"]
promtool query instant http://localhost:9090 'etc_hosts_ip_count'
etc_hosts_ip_count{instance="laptop.prometheus.home:9108", job="etc_hosts"} => 4 @[1696597793.314]
It is obviously possible to do the same thing with a Python, Java, Node, etc. script.
Recording Rules
A recording rule is a simplification of a PromQL query. It works in the same way as a query but is executed upstream and stored in a new metric.
It is a way to optimize queries that are executed regularly and thus avoid overloading Prometheus (especially when dealing with a dashboard that repeats the same PromQL code at each refresh interval).
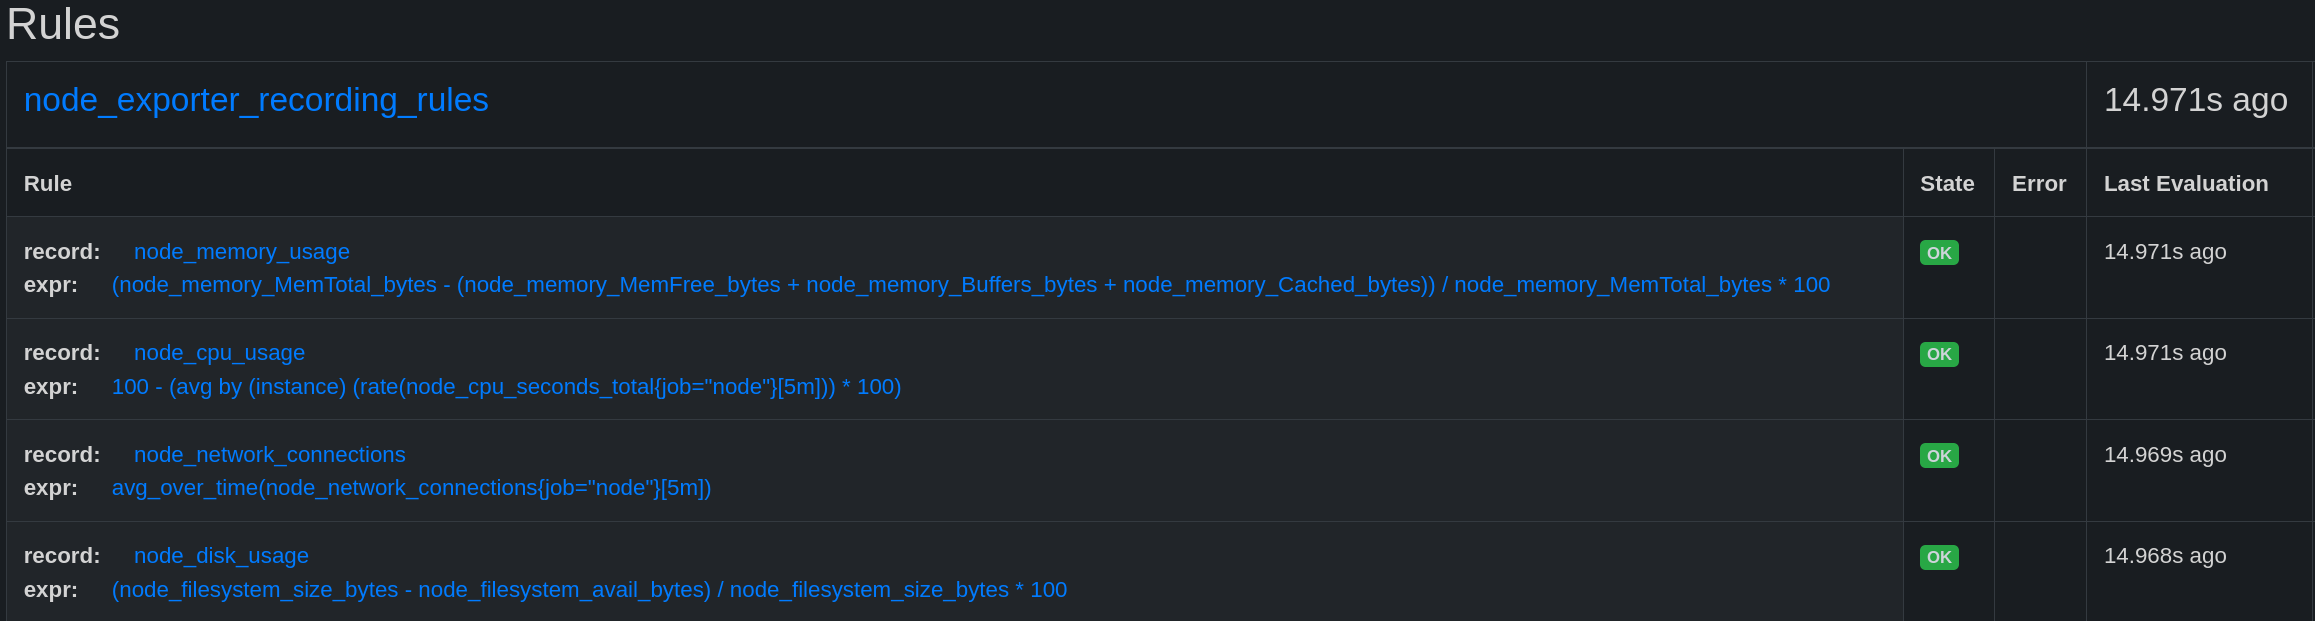
Recording rules must be created in one or more files. For example, I will create a file nodes.yml in the /etc/prometheus/rules/ directory (create the directory if it doesn’t exist) and add the following rules:
groups:
  - name: node_exporter_recording_rules
    rules:
      - record: node_memory_usage
        expr: (node_memory_MemTotal_bytes - (node_memory_MemFree_bytes + node_memory_Buffers_bytes + node_memory_Cached_bytes)) / node_memory_MemTotal_bytes * 100
      - record: node_cpu_usage
        expr: 100 - (avg by (instance) (rate(node_cpu_seconds_total{job="node"}[5m])) * 100)
      - record: node_network_connections
        expr: avg_over_time(node_network_connections{job="node"}[5m])
      - record: node_disk_usage
        expr: (node_filesystem_size_bytes - node_filesystem_avail_bytes) / node_filesystem_size_bytes * 100
The names of the rules must be unique and follow the regex pattern [a-zA-Z_:][a-zA-Z0-9_:]* (same rule as for regular metrics).
After that, you need to add the rule file to the Prometheus configuration:
global:
  scrape_interval: 15s
  evaluation_interval: 15s
# ...
rule_files:  # <--- references the rule files
  - "single_file.yml"
  - "rules/*.yml"
After reloading Prometheus, we can see that the rules are present in the Status->Rules tab.
These rules can be used in our PromQL queries, and we can add filters just like for regular metrics.
Alerts
I mentioned at the beginning of this article: Prometheus is capable of alerting us when a metric exceeds a certain threshold. This is a very important feature for a monitoring tool.
But… I lied to you. Prometheus does declare alerts, but it is unable to send them to us through any means. Therefore, we need to use another tool to manage the sending of alerts. Prometheus’s role is just to “declare” its alerts to the chosen tool once the critical thresholds are reached.
Creating an alert
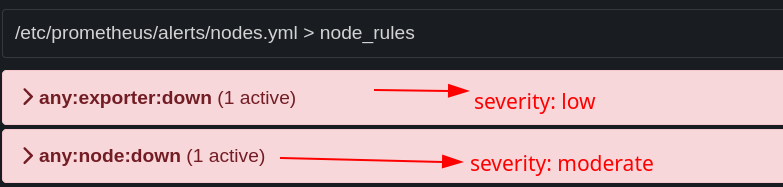
The alerts are declared in the same files as the Recording Rules. So I create the directory /etc/prometheus/alerts/ and add the file nodes.yml with the following content:
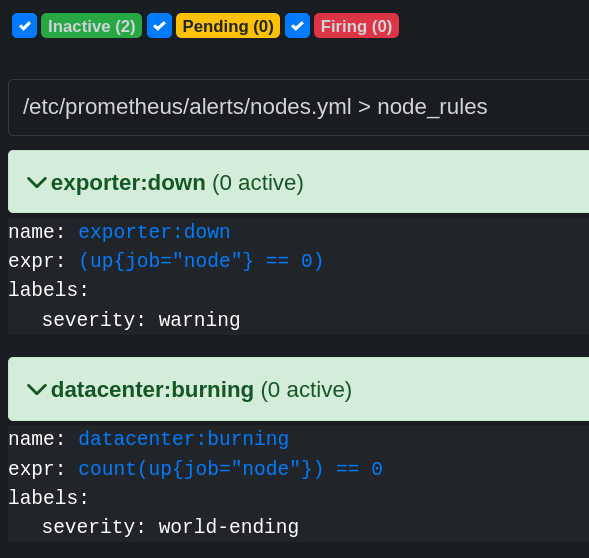
groups:
 - name: node_rules
   rules:
    - alert: any:exporter:down
      expr: >
       ( up == 0 )
      labels:
        severity: low

    - alert: any:node:down
      expr: >
       ( up{job="node"} == 0 )
      labels:
        severity: moderate

    - alert: datacenter:burning
      expr: count(up{job="node"}) == 0
      labels:
        severity: world-ending
      for: 5m
These alerts can be seen in the Status->Alerts tab.
any:exporter:down: alert if an exporter is down.any:node:down: alert if a node exporter is down.datacenter:burning: alert if all node exporters are down.
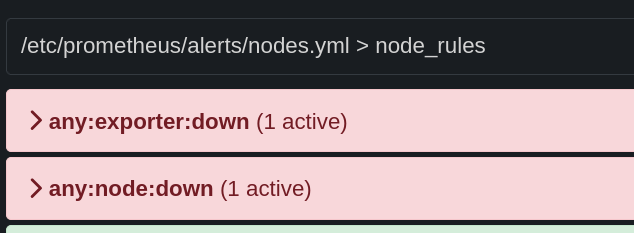
If I stop the NodeExporter service on my laptop, I can see that the any:exporter:down and any:node:down alerts are triggered.
Now… how do we receive these alerts?
AlertManager
AlertManager is a tool for managing Prometheus alerts. It can receive alerts from Prometheus and send them via various channels (email, Slack, webhook, etc). It can also handle silences and group alerts.
Installation
AlertManager is available in the official repositories of most Linux distributions.
apt install prometheus-alertmanager
apk add alertmanager
yum install prometheus-alertmanager
AlertManager can also be installed via Docker:
docker run -d -p 9093:9093 \
  --name alertmanager \
  -v /etc/alertmanager/config.yml:/etc/alertmanager/config.yml \
  prom/alertmanager
Or via the archive available on the official GitHub: github.com/prometheus/alertmanager/releases.
Once started, it is accessible on port 9093. It can be configured using the /etc/alertmanager/config.yml file.
AlertManager must be declared in the Prometheus configuration:
global:
  scrape_interval: 5s
  evaluation_interval: 15s

alerting:
  alertmanagers:
    - static_configs:
        - targets:
          - server.prometheus.home:9093 # <---- ici !
rule_files:
  - "rules/*.yml"
  - "alerts/*.yml"
# ...
And from the moment Prometheus is restarted, it will send alerts to AlertManager whenever they exceed the thresholds defined in the rule files.
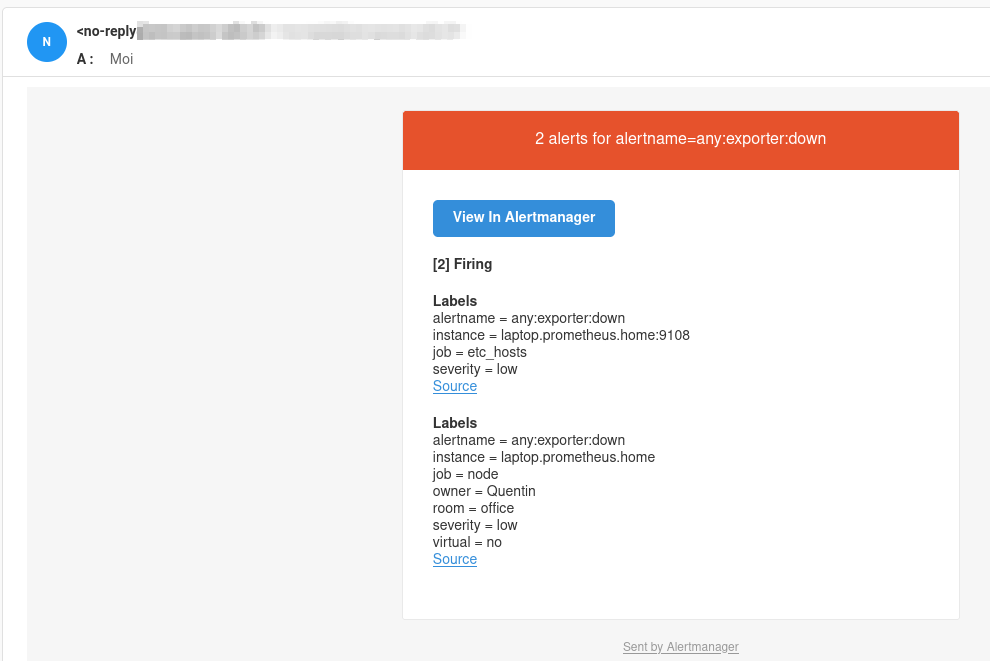
In my case, I have configured alerts that send emails via my SMTP server:
receivers:
  - name: 'web.hook'
    webhook_configs:
      - url: 'http://127.0.0.1:5001/'
  - name: 'email'
    email_configs:
    - to: 'contact@mailserver'
      from: 'no-reply@mailserver'
      smarthost: 'mailserver:587'
      auth_username: 'no-reply@mailserver'
      auth_identity: 'no-reply@mailserver'
      auth_password: 'bigpassword'
Inhibit Rules
Now, the any:exporter:down alert is not relevant if another more important alert is triggered (such as any:node:down). This is where inhibit rules come into play in AlertManager.
inhibit_rules:
 - source_matchers:
     - severity = moderate
   target_matchers:
     - severity = low
   equal: ['instance']
With this configuration, if a moderate severity alert is triggered, all low severity alerts will be inhibited as long as they have the same instance label (which requires relabeling if it’s not the same exporter) (see relabeling).
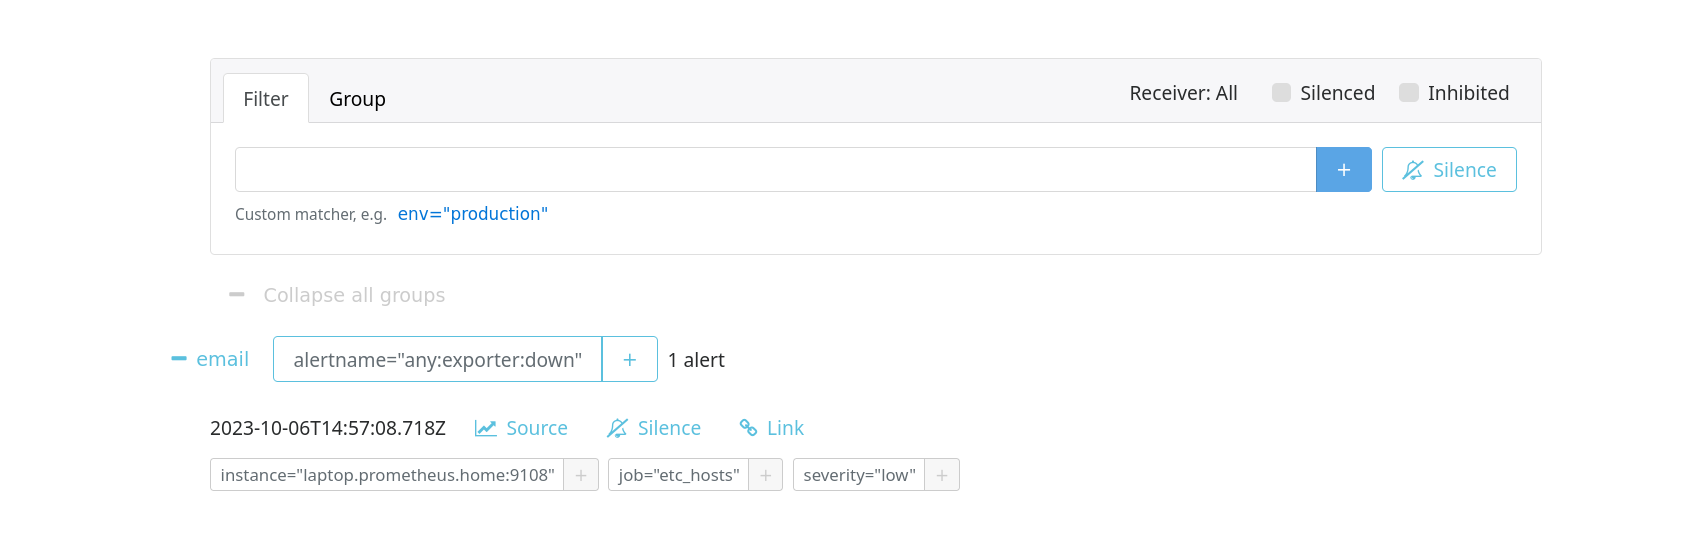
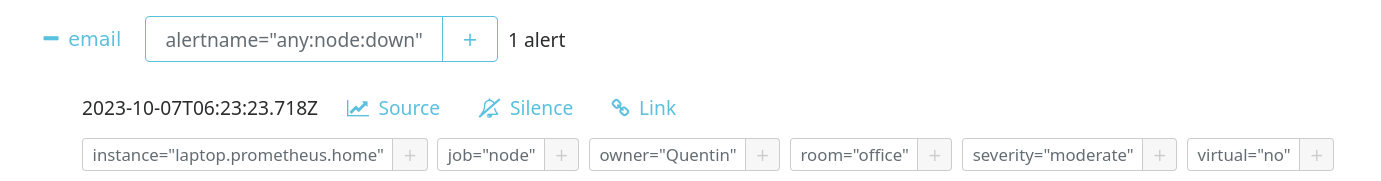
Now, if I stop the NodeExporter service on my laptop, I can see that the any:exporter:down alert is indeed inhibited by the any:node:down alert.
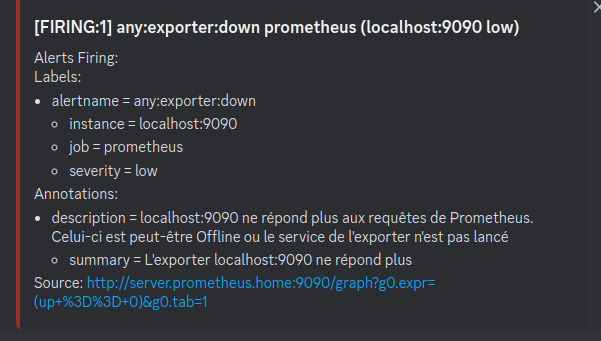
On Prometheus, both alerts are triggered correctly:
On AlertManager, only the any:node:down alert is visible:
Alert Routing
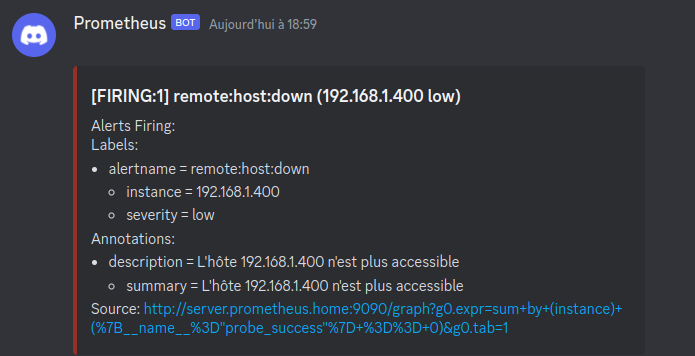
AlertManager is capable of routing alerts based on their labels. For example, I want alerts with severity low to be sent to support A, and alerts with severity moderate to be sent to support B.
I consider emails to be dedicated to important alerts. So, I will create a new receiver for low alerts and modify the email receiver for moderate alerts.
In my usual setup, I tend to use Gotify, but since I’m not at home during the editing of this article, I will use Discord as an alternative.
I add Discord as a receiver in the /etc/alertmanager/alertmanager.yml file:
receivers:
  - name: 'discord'
    discord_configs:
    - webhook_url: 'https://discord.com/api/webhooks/1160256074398568488/HT18QHDiqNOwoQL7P2XFAhnOoASYFyX-bSKtLM1EZMA2812Nb2kUMRzr7BiHmhO1amHY'
Since the labels are already present in the Prometheus alerts, all we need to do is create a route for each severity in the /etc/alertmanager/alertmanager.yml file:
route:
  group_by: ['alertname']
  group_wait: 20s
  group_interval: 5m
  repeat_interval: 3h
  receiver: email # par défaut

  routes:
  - matchers:
    - severity =~ "(low|info)"
    receiver: discord
Now, alerts with low and info severity will be sent to Discord, and the rest will be sent via email.
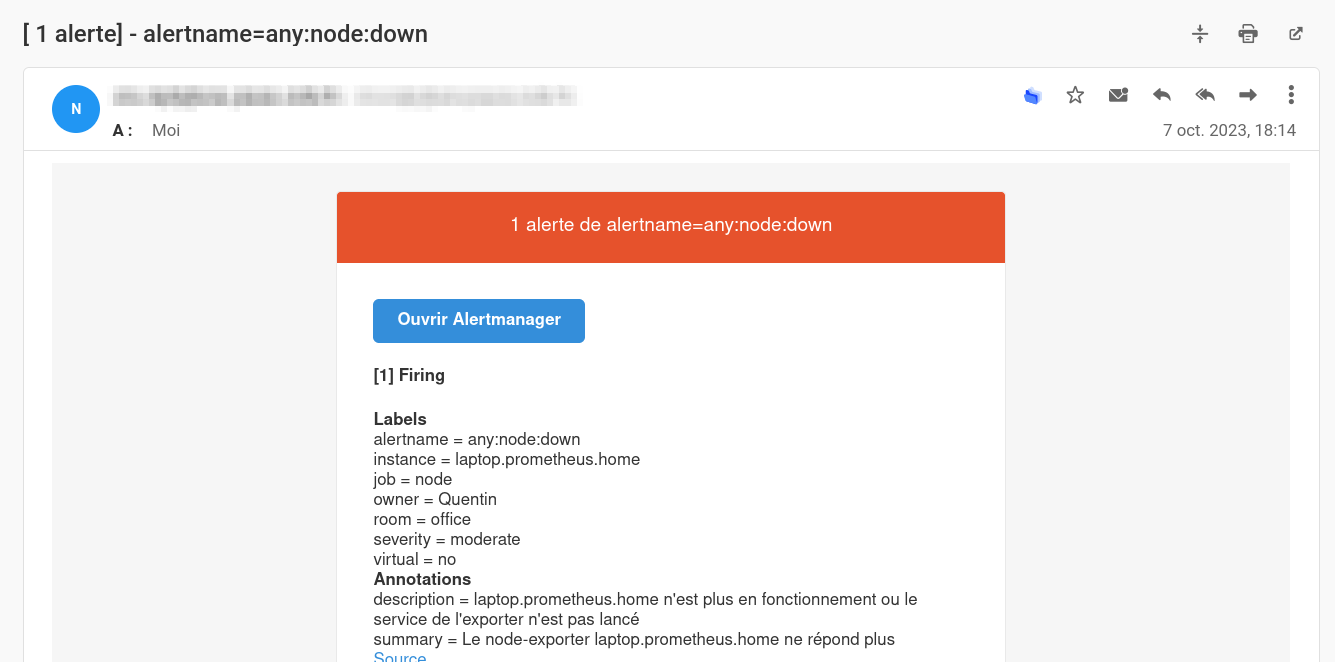
Customize alerts
Change email subject
It is possible to customize alerts using templates. The format is similar to Jinja2 (used by Ansible) or GoTmpl.
In my case, the default template for emails doesn’t quite fit. I want to have a more descriptive subject and a body in French.
- Default template:
To do this, the alertmanager.yml file must be updated with the following content:
- name: 'email'
email_configs:
- to: 'contact@mailserver'
from: 'no-reply@mailserver'
smarthost: 'mailserver:587'
auth_username: 'no-reply@mailserver'
auth_identity: 'no-reply@mailserver'
auth_password: 'bigpassword'
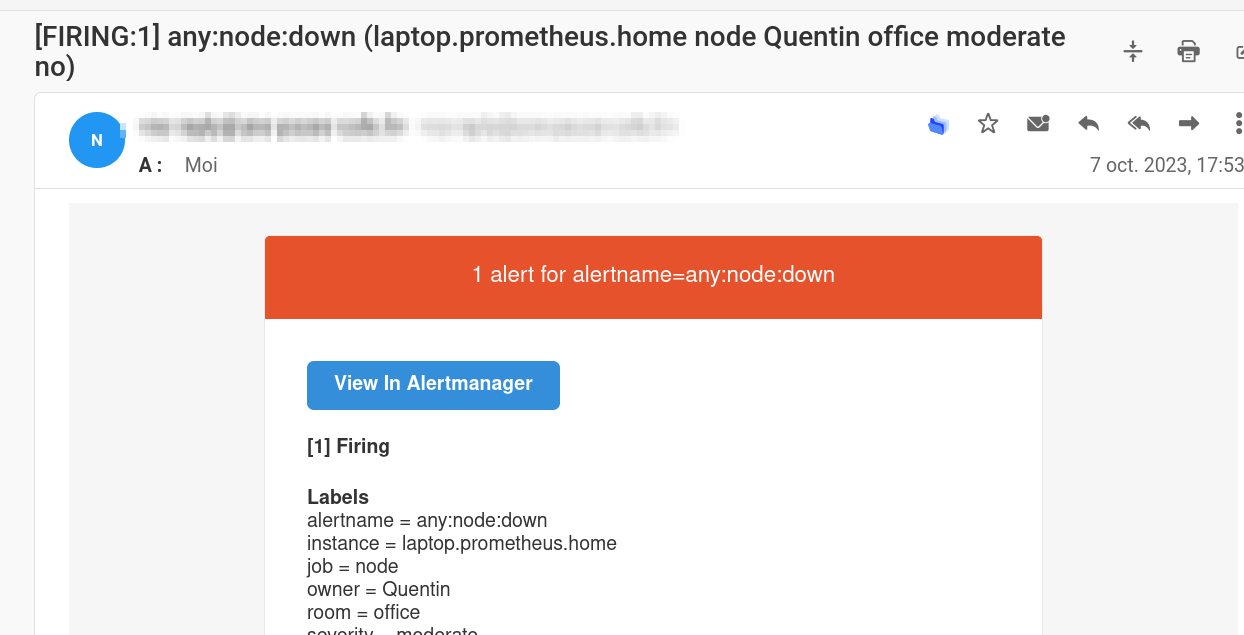
headers:
Subject: "[ {{ .Alerts | len }} alerte{{ if gt (len .Alerts) 1 }}s{{ end }}] - {{ range .GroupLabels.SortedPairs }}{{ .Name }}={{ .Value }}{{ end }}"
I use the Subject header to modify the email subject. I also use the len function to count the number of alerts and make “alert” plural if necessary.
Change the email body
I don’t want to completely replicate the default template for the email body. I just want to translate the text into French.
So, I will download the default template available on the official AlertManager GitHub.
wget https://raw.githubusercontent.com/prometheus/alertmanager/main/template/email.tmpl -O /etc/alertmanager/email.tmpl
I modify the name of the template inside the file from “email.default.subject” to “email.subject” so that the name is different from the default template. I also modify the content of the template to have a French email body.
Template file
{{ define "email.subject" }}{{ template "__subject" . }}{{ end }}
{{ define "email.html" }}
<html xmlns="http://www.w3.org/1999/xhtml" style="margin: 0; font-family: 'Helvetica Neue', Helvetica, Arial, sans-serif; box-sizing: border-box; font-size: 14px;">
<head>
<meta name="viewport" content="width=device-width">
<meta http-equiv="Content-Type" content="text/html; charset=UTF-8">
<title>{{ template "__subject" . }}</title>
<style>
@media only screen and (max-width: 640px) {
  body {
    padding: 0 !important;
  }

  h1,
h2,
h3,
h4 {
    font-weight: 800 !important;
    margin: 20px 0 5px !important;
  }

  h1 {
    font-size: 22px !important;
  }

  h2 {
    font-size: 18px !important;
  }

  h3 {
    font-size: 16px !important;
  }

  .container {
    padding: 0 !important;
    width: 100% !important;
  }

  .content {
    padding: 0 !important;
  }

  .content-wrap {
    padding: 10px !important;
  }

  .invoice {
    width: 100% !important;
  }
}
</style>
</head>

<body itemscope itemtype="https://schema.org/EmailMessage" style="margin: 0; font-family: 'Helvetica Neue', Helvetica, Arial, sans-serif; box-sizing: border-box; font-size: 14px; -webkit-font-smoothing: antialiased; -webkit-text-size-adjust: none; height: 100%; line-height: 1.6em; background-color: #f6f6f6; width: 100%;">

<table class="body-wrap" style="margin: 0; font-family: 'Helvetica Neue', Helvetica, Arial, sans-serif; box-sizing: border-box; font-size: 14px; background-color: #f6f6f6; width: 100%;" width="100%" bgcolor="#f6f6f6">
  <tr style="margin: 0; font-family: 'Helvetica Neue', Helvetica, Arial, sans-serif; box-sizing: border-box; font-size: 14px;">
    <td style="margin: 0; font-family: 'Helvetica Neue', Helvetica, Arial, sans-serif; box-sizing: border-box; font-size: 14px; vertical-align: top;" valign="top"></td>
    <td class="container" width="600" style="font-family: 'Helvetica Neue', Helvetica, Arial, sans-serif; box-sizing: border-box; font-size: 14px; vertical-align: top; display: block; max-width: 600px; margin: 0 auto; clear: both;" valign="top">
      <div class="content" style="font-family: 'Helvetica Neue', Helvetica, Arial, sans-serif; box-sizing: border-box; font-size: 14px; max-width: 600px; margin: 0 auto; display: block; padding: 20px;">
        <table class="main" width="100%" cellpadding="0" cellspacing="0" style="margin: 0; font-family: 'Helvetica Neue', Helvetica, Arial, sans-serif; box-sizing: border-box; font-size: 14px; background-color: #fff; border: 1px solid #e9e9e9; border-radius: 3px;" bgcolor="#fff">
          <tr style="margin: 0; font-family: 'Helvetica Neue', Helvetica, Arial, sans-serif; box-sizing: border-box; font-size: 14px;">
            {{ if gt (len .Alerts.Firing) 0 }}
            <td class="alert alert-warning" style="margin: 0; font-family: 'Helvetica Neue', Helvetica, Arial, sans-serif; box-sizing: border-box; vertical-align: top; font-size: 16px; color: #fff; font-weight: 500; padding: 20px; text-align: center; border-radius: 3px 3px 0 0; background-color: #E6522C;" valign="top" align="center" bgcolor="#E6522C">
              {{ .Alerts | len }} alerte{{ if gt (len .Alerts) 1 }}s{{ end }} de {{ range .GroupLabels.SortedPairs }}
                {{ .Name }}={{ .Value }}
              {{ end }}
            </td>
            {{ else }}
            <td class="alert alert-good" style="margin: 0; font-family: 'Helvetica Neue', Helvetica, Arial, sans-serif; box-sizing: border-box; vertical-align: top; font-size: 16px; color: #fff; font-weight: 500; padding: 20px; text-align: center; border-radius: 3px 3px 0 0; background-color: #68B90F;" valign="top" align="center" bgcolor="#68B90F">
              {{ .Alerts | len }} alerte{{ if gt (len .Alerts) 1 }}s{{ end }} de {{ range .GroupLabels.SortedPairs }}
                {{ .Name }}={{ .Value }}
              {{ end }}
            </td>
            {{ end }}
          </tr>
          <tr style="margin: 0; font-family: 'Helvetica Neue', Helvetica, Arial, sans-serif; box-sizing: border-box; font-size: 14px;">
            <td class="content-wrap" style="margin: 0; font-family: 'Helvetica Neue', Helvetica, Arial, sans-serif; box-sizing: border-box; font-size: 14px; vertical-align: top; padding: 30px;" valign="top">
              <table width="100%" cellpadding="0" cellspacing="0" style="margin: 0; font-family: 'Helvetica Neue', Helvetica, Arial, sans-serif; box-sizing: border-box; font-size: 14px;">
                <tr style="margin: 0; font-family: 'Helvetica Neue', Helvetica, Arial, sans-serif; box-sizing: border-box; font-size: 14px;">
                  <td class="content-block" style="margin: 0; font-family: 'Helvetica Neue', Helvetica, Arial, sans-serif; box-sizing: border-box; font-size: 14px; vertical-align: top; padding: 0 0 20px;" valign="top">
                    <a href="{{ template "__alertmanagerURL" . }}" class="btn-primary" style="margin: 0; font-family: 'Helvetica Neue', Helvetica, Arial, sans-serif; box-sizing: border-box; font-size: 14px; text-decoration: none; color: #FFF; background-color: #348eda; border: solid #348eda; border-width: 10px 20px; line-height: 2em; font-weight: bold; text-align: center; cursor: pointer; display: inline-block; border-radius: 5px; text-transform: capitalize;">Ouvrir {{ template "__alertmanager" . }}</a>
                  </td>
                </tr>
                {{ if gt (len .Alerts.Firing) 0 }}
                <tr style="margin: 0; font-family: 'Helvetica Neue', Helvetica, Arial, sans-serif; box-sizing: border-box; font-size: 14px;">
                  <td class="content-block" style="margin: 0; font-family: 'Helvetica Neue', Helvetica, Arial, sans-serif; box-sizing: border-box; font-size: 14px; vertical-align: top; padding: 0 0 20px;" valign="top">
                    <strong style="margin: 0; font-family: 'Helvetica Neue', Helvetica, Arial, sans-serif; box-sizing: border-box; font-size: 14px;">[{{ .Alerts.Firing | len }}] Firing</strong>
                  </td>
                </tr>
                {{ end }}
                {{ range .Alerts.Firing }}
                <tr style="margin: 0; font-family: 'Helvetica Neue', Helvetica, Arial, sans-serif; box-sizing: border-box; font-size: 14px;">
                  <td class="content-block" style="margin: 0; font-family: 'Helvetica Neue', Helvetica, Arial, sans-serif; box-sizing: border-box; font-size: 14px; vertical-align: top; padding: 0 0 20px;" valign="top">
                    <strong style="margin: 0; font-family: 'Helvetica Neue', Helvetica, Arial, sans-serif; box-sizing: border-box; font-size: 14px;">Labels</strong><br style="margin: 0; font-family: 'Helvetica Neue', Helvetica, Arial, sans-serif; box-sizing: border-box; font-size: 14px;">
                    {{ range .Labels.SortedPairs }}{{ .Name }} = {{ .Value }}<br style="margin: 0; font-family: 'Helvetica Neue', Helvetica, Arial, sans-serif; box-sizing: border-box; font-size: 14px;">{{ end }}
                    {{ if gt (len .Annotations) 0 }}<strong style="margin: 0; font-family: 'Helvetica Neue', Helvetica, Arial, sans-serif; box-sizing: border-box; font-size: 14px;">Annotations</strong><br style="margin: 0; font-family: 'Helvetica Neue', Helvetica, Arial, sans-serif; box-sizing: border-box; font-size: 14px;">{{ end }}
                    {{ range .Annotations.SortedPairs }}{{ .Name }} = {{ .Value }}<br style="margin: 0; font-family: 'Helvetica Neue', Helvetica, Arial, sans-serif; box-sizing: border-box; font-size: 14px;">{{ end }}
                    <a href="{{ .GeneratorURL }}" style="margin: 0; font-family: 'Helvetica Neue', Helvetica, Arial, sans-serif; box-sizing: border-box; font-size: 14px; color: #348eda; text-decoration: underline;">Source</a><br style="margin: 0; font-family: 'Helvetica Neue', Helvetica, Arial, sans-serif; box-sizing: border-box; font-size: 14px;">
                  </td>
                </tr>
                {{ end }}

                {{ if gt (len .Alerts.Resolved) 0 }}
                  {{ if gt (len .Alerts.Firing) 0 }}
                <tr style="margin: 0; font-family: 'Helvetica Neue', Helvetica, Arial, sans-serif; box-sizing: border-box; font-size: 14px;">
                  <td class="content-block" style="margin: 0; font-family: 'Helvetica Neue', Helvetica, Arial, sans-serif; box-sizing: border-box; font-size: 14px; vertical-align: top; padding: 0 0 20px;" valign="top">
                    <br style="margin: 0; font-family: 'Helvetica Neue', Helvetica, Arial, sans-serif; box-sizing: border-box; font-size: 14px;">
                    <hr style="margin: 0; font-family: 'Helvetica Neue', Helvetica, Arial, sans-serif; box-sizing: border-box; font-size: 14px;">
                    <br style="margin: 0; font-family: 'Helvetica Neue', Helvetica, Arial, sans-serif; box-sizing: border-box; font-size: 14px;">
                  </td>
                </tr>
                  {{ end }}
                <tr style="margin: 0; font-family: 'Helvetica Neue', Helvetica, Arial, sans-serif; box-sizing: border-box; font-size: 14px;">
                  <td class="content-block" style="margin: 0; font-family: 'Helvetica Neue', Helvetica, Arial, sans-serif; box-sizing: border-box; font-size: 14px; vertical-align: top; padding: 0 0 20px;" valign="top">
                    <strong style="margin: 0; font-family: 'Helvetica Neue', Helvetica, Arial, sans-serif; box-sizing: border-box; font-size: 14px;">[{{ .Alerts.Resolved | len }}] Resolved</strong>
                  </td>
                </tr>
                {{ end }}
                {{ range .Alerts.Resolved }}
                <tr style="margin: 0; font-family: 'Helvetica Neue', Helvetica, Arial, sans-serif; box-sizing: border-box; font-size: 14px;">
                  <td class="content-block" style="margin: 0; font-family: 'Helvetica Neue', Helvetica, Arial, sans-serif; box-sizing: border-box; font-size: 14px; vertical-align: top; padding: 0 0 20px;" valign="top">
                    <strong style="margin: 0; font-family: 'Helvetica Neue', Helvetica, Arial, sans-serif; box-sizing: border-box; font-size: 14px;">Labels</strong><br style="margin: 0; font-family: 'Helvetica Neue', Helvetica, Arial, sans-serif; box-sizing: border-box; font-size: 14px;">
                    {{ range .Labels.SortedPairs }}{{ .Name }} = {{ .Value }}<br style="margin: 0; font-family: 'Helvetica Neue', Helvetica, Arial, sans-serif; box-sizing: border-box; font-size: 14px;">{{ end }}
                    {{ if gt (len .Annotations) 0 }}<strong style="margin: 0; font-family: 'Helvetica Neue', Helvetica, Arial, sans-serif; box-sizing: border-box; font-size: 14px;">Annotations</strong><br style="margin: 0; font-family: 'Helvetica Neue', Helvetica, Arial, sans-serif; box-sizing: border-box; font-size: 14px;">{{ end }}
                    {{ range .Annotations.SortedPairs }}{{ .Name }} = {{ .Value }}<br style="margin: 0; font-family: 'Helvetica Neue', Helvetica, Arial, sans-serif; box-sizing: border-box; font-size: 14px;">{{ end }}
                    <a href="{{ .GeneratorURL }}" style="margin: 0; font-family: 'Helvetica Neue', Helvetica, Arial, sans-serif; box-sizing: border-box; font-size: 14px; color: #348eda; text-decoration: underline;">Source</a><br style="margin: 0; font-family: 'Helvetica Neue', Helvetica, Arial, sans-serif; box-sizing: border-box; font-size: 14px;">
                  </td>
                </tr>
                {{ end }}
              </table>
            </td>
          </tr>
        </table>

        <div class="footer" style="margin: 0; font-family: 'Helvetica Neue', Helvetica, Arial, sans-serif; box-sizing: border-box; font-size: 14px; width: 100%; clear: both; color: #999; padding: 20px;">
          <table width="100%" style="margin: 0; font-family: 'Helvetica Neue', Helvetica, Arial, sans-serif; box-sizing: border-box; font-size: 14px;">
            <tr style="margin: 0; font-family: 'Helvetica Neue', Helvetica, Arial, sans-serif; box-sizing: border-box; font-size: 14px;">
              <td class="aligncenter content-block" style="margin: 0; font-family: 'Helvetica Neue', Helvetica, Arial, sans-serif; box-sizing: border-box; vertical-align: top; padding: 0 0 20px; text-align: center; color: #999; font-size: 12px;" valign="top" align="center"><a href="{{ .ExternalURL }}" style="margin: 0; font-family: 'Helvetica Neue', Helvetica, Arial, sans-serif; box-sizing: border-box; text-decoration: underline; color: #999; font-size: 12px;">Sent by {{ template "__alertmanager" . }}</a></td>
            </tr>
          </table>
        </div></div>
    </td>
    <td style="margin: 0; font-family: 'Helvetica Neue', Helvetica, Arial, sans-serif; box-sizing: border-box; font-size: 14px; vertical-align: top;" valign="top"></td>
  </tr>
</table>

</body>
</html>

{{ end }}
- Modified template:
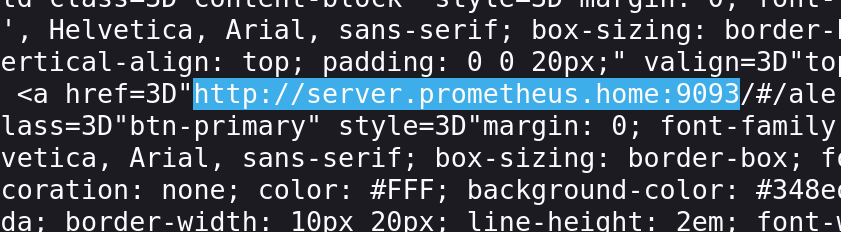
Modifying URLs in the received email
When you receive an alert email, you may have noticed that the URLs are not accessible as it will propose the URL http://prometheus:9090 for Prometheus and http://alertmanager:9093 for AlertManager.
Especially on the Source and Open AlertManager buttons.
To fix this, you need to start Prometheus and AlertManager with the --web.external-url and --web.route-prefix options.
Here are the default values:
--web.external-url:http://localhost:9090--web.route-prefix:/
Depending on how you want to access Prometheus and AlertManager, you may need to adjust these values (especially if you are behind a reverse proxy).
In my case, I want to access Prometheus and AlertManager via the URL http://server.prometheus.home:9090 and http://server.prometheus.home:9093.
It is necessary to modify the OpenRC or Systemd service to add the --web.external-url option (and --web.route-prefix if desired).
For OpenRC, I modify the file /etc/conf.d/prometheus to set a value in the prometheus_arg variable:
prometheus_config_file=/etc/prometheus/prometheus.yml
prometheus_storage_path=/var/lib/prometheus/data
prometheus_retention_time=15d
prometheus_args="--web.external-url='http://server.prometheus.home:9090'"

output_log=/var/log/prometheus.log
error_log=/var/log/prometheus.log
In the context of a systemd service, I modify the file /etc/default/prometheus to set a value in the ARGS variable:
ARGS="--web.external-url='http://server.prometheus.home:9090'"
For AlertManager, it’s the same thing. I modify the file /etc/conf.d/alertmanager to set a value in the alertmanager_arg variable:
alertmanager_args="--web.external-url='http://server.prometheus.home:9093'"
alertmanager_config_file=/etc/alertmanager/alertmanager.yml
alertmanager_storage_path=/var/lib/alertmanager/data

output_log=/var/log/alertmanager.log
error_log=/var/log/alertmanager.log
In the final email, the URLs to Prometheus and AlertManager no longer redirect to http://prometheus:9090 and http://alertmanager:9093, but rather to http://server.prometheus.home:9090 and http://server.prometheus.home:9093.
PushGateway
So far, we have seen how to retrieve metrics from remote hosts. But what about cases where we need to retrieve metrics from a host that is not accessible by Prometheus (for example, a dynamic IP) or is not supposed to be accessible 24/7?
For example, a script that will be executed once a day and will retrieve metrics, or a script that will be executed every time a Docker container starts.
To address this issue, there is a solution: PushGateway.
It is a service that aims to retrieve metrics via POST requests and add them to its exporter that Prometheus can query.
Tasks using PushGateway are not required to be launched during a Prometheus pull. PushGateway acts as an intermediary.
Installation
PushGateway is available in the official repositories of most Linux distributions:
apt install prometheus-pushgateway
apk add prometheus-pushgateway
yum install prometheus-pushgateway
Or via Docker:
docker run -d -p 9091:9091 prom/pushgateway
Or via the archive available on the official GitHub: github.com/prometheus/pushgateway/releases.
Usage
As explained above, PushGateway’s role is to retrieve metrics from scripts or applications that are not intended to be accessible 24/7.
To do this, we will send HTTP requests to PushGateway for it to store them. This can be done using a Bash script, Python, Node, etc.
/metrics/job/<JOB_NAME>{/<LABEL_NAME>/<LABEL_VALUE>}
With the following code, I want to send the disk_temperature_celsius metric containing the temperature of my NVME disk.
#!/bin/bash
hostname=$(cat /etc/hostname)
kelvin=$(sudo nvme smart-log /dev/nvme0 -o json | jq '.["temperature_sensor_1"]')
celsius=$(echo "$kelvin - 273.15" | bc)

echo "La température du disque /dev/nvme0 est ${celsius}°C"
cat <<EOF | curl --data-binary @- http://server.prometheus.home:9091/metrics/job/disk_temperature_celsius/instance/capteur
# TYPE disk_temperature_celsius gauge
disk_temperature_celsius{instance="${hostname}"} ${celsius}
EOF
From the web interface, we can see that the metric is successfully sent:
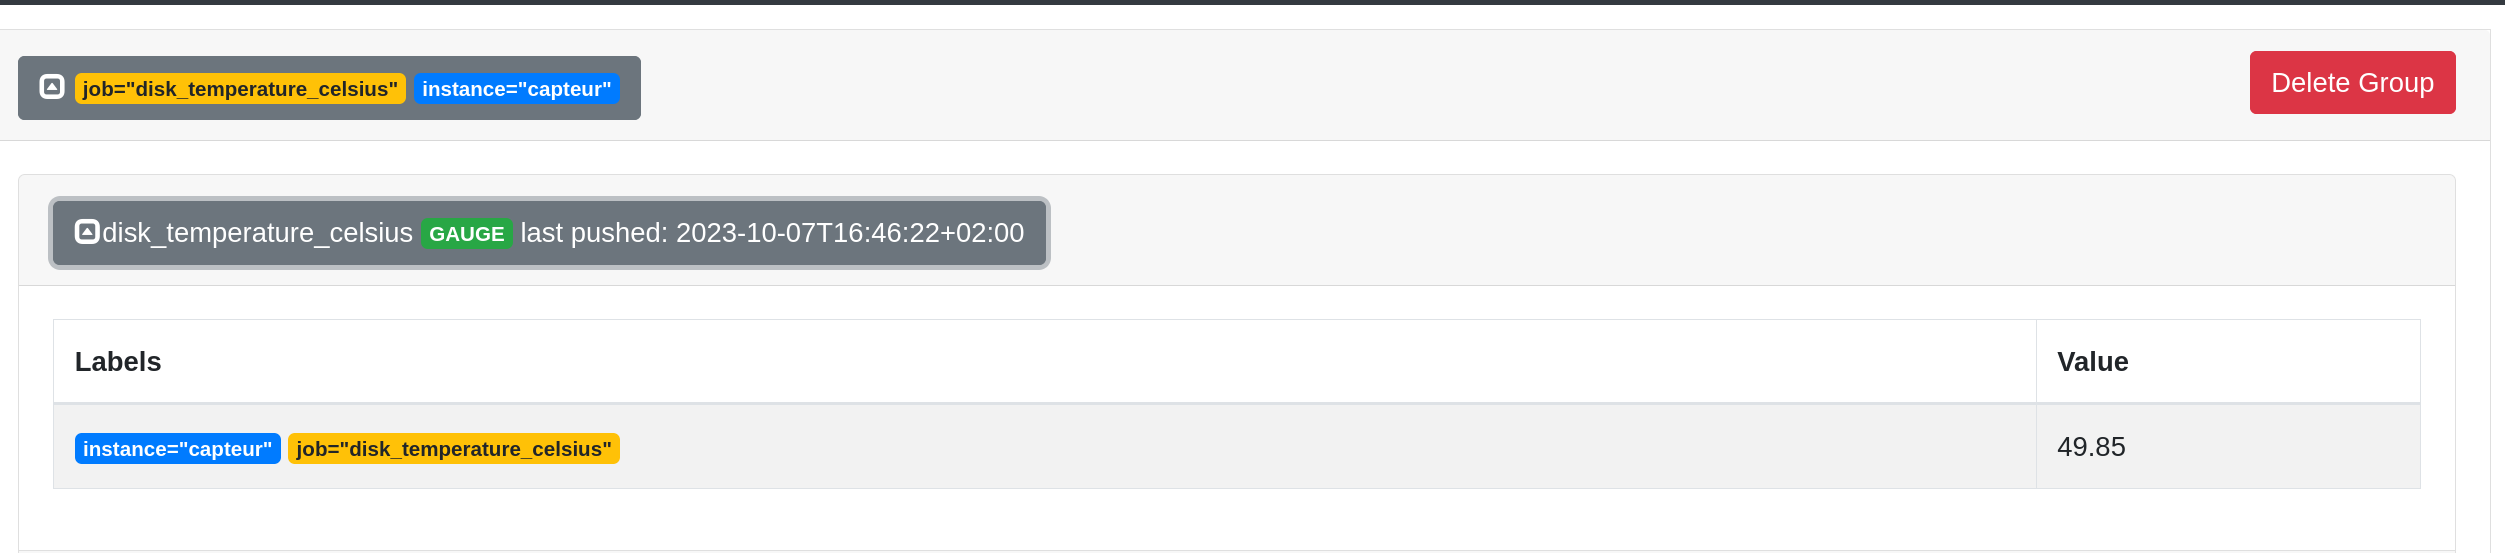
Each pushed metric is stored in PushGateway until it is overwritten by a new metric with the same name. Therefore, it is possible to push multiple metrics with the same name but with different labels.
PushGateway exposes these metrics on port 9091 with the path /metrics.
curl http://server.prometheus.home:9091/metrics -s | grep "disk_temperature_celsius"


# TYPE disk_temperature_celsius gauge
disk_temperature_celsius{instance="capteur",job="disk_temperature_celsius"} 49.85
push_failure_time_seconds{instance="capteur",job="disk_temperature_celsius"} 0
push_time_seconds{instance="capteur",job="disk_temperature_celsius"} 1.6966899829492722e+09
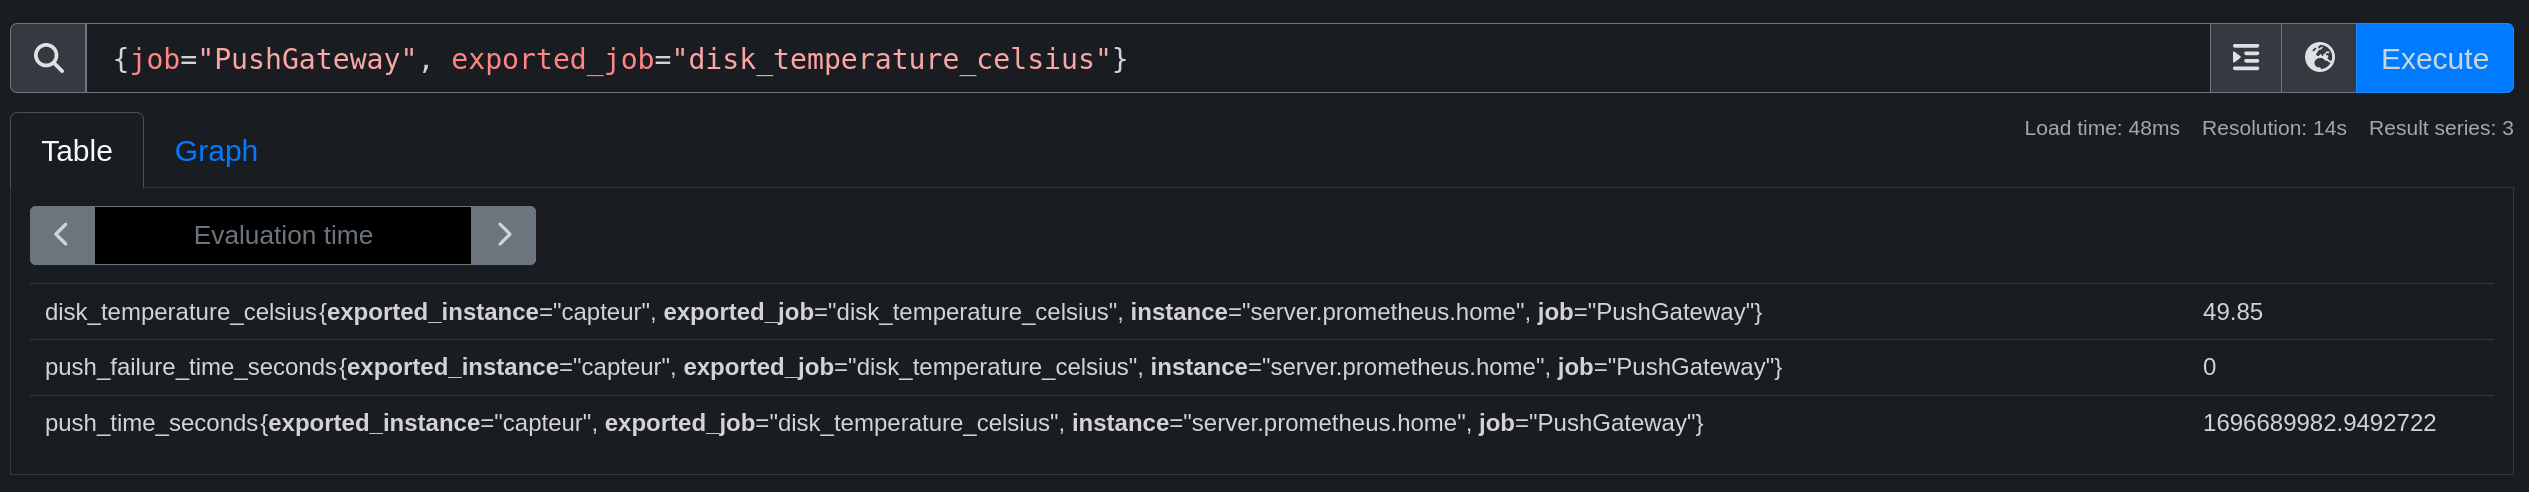
Now we need to add PushGateway to the Prometheus configuration:
  - job_name: "PushGateway"
    static_configs:
      - targets: ["server.prometheus.home:9091"]
    relabel_configs:
      - source_labels: [__address__]
        regex: '(.*):[0-9]+'
        replacement: '${1}'
        target_label: instance
We can see that the metric is successfully retrieved by Prometheus:
Prometheus and Security
Here, we will see how to secure the communication between Prometheus and exporters.
To secure Prometheus, there are several solutions:
- Basic authentication.
- Encrypting the communication with TLS.
- Using a firewall to limit access to exporters (or reverse proxy).
We will see how to implement the first two solutions.
Enable basic authentication
On Prometheus
First, it is necessary to generate the encrypted password using the htpasswd command or the Python script gen-pass.py available in the official Prometheus documentation.
import getpass
import bcrypt

password = getpass.getpass("password: ")
hashed_password = bcrypt.hashpw(password.encode("utf-8"), bcrypt.gensalt())
print(hashed_password.decode())
Je génère mon mot de passe (qui sera ici Coffee) :
python3 gen-pass.py
password:
$2b$12$W1jWulWeeF2LECdJMZc2G.i5fvJGSl5CE8F6Flz3tW4Uz7yBdUWZ.
Now we will create a YAML file that will contain the configuration of the Prometheus web server. This file is separate from the main configuration and can be reused for other services (exporters, alertmanager, etc).
Creating the directory:
mkdir -p /etc/prometheus/web
File web.yml:
basic_auth_users:
  admin: $2b$12$W1jWulWeeF2LECdJMZc2G.i5fvJGSl5CE8F6Flz3tW4Uz7yBdUWZ.
  ops: $2b$12$W1jWulWeeF2LECdJMZc2G.i5fvJGSl5CE8F6Flz3tW4Uz7yBdUWZ.
You also need to modify the startup arguments of Prometheus to enable basic_auth authentication by adding --web.config.file=/etc/prometheus/web/web.yml as during the configuration of the external URL.
I modify the file /etc/conf.d/prometheus to add our argument. Here is my final file:
prometheus_config_file=/etc/prometheus/prometheus.yml
prometheus_storage_path=/var/lib/prometheus/data
prometheus_retention_time=15d
prometheus_args="--web.external-url='http://server.prometheus.home:9090' --web.config.file=/etc/prometheus/web/web.yml"

output_log=/var/log/prometheus.log
error_log=/var/log/prometheus.log
If you are using a systemd service, you will need to modify the /etc/default/prometheus file to add our argument. Here is an example:
ARGS="--web.external-url='http://server.prometheus.home:9090' --web.config.file=/etc/prometheus/web/web.yml"
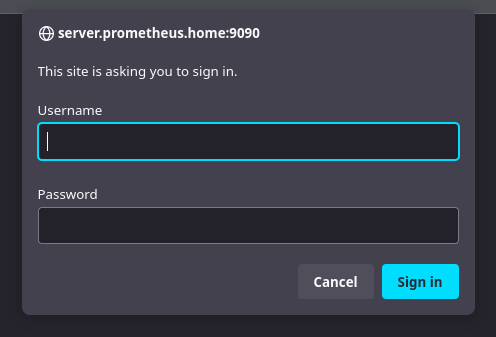
After restarting Prometheus, it is possible to connect using the credentials admin or ops:
Now… I just received an email regarding a certain alert any:exporter:down telling me that my exporter node-exporter is down.
Why? Because Prometheus is no longer able to self-monitor. It can no longer access localhost:9090/metrics and that’s normal since we just enabled basic_auth authentication.
We need to modify our exporter inventory to add authentication:
  - job_name: "prometheus"
    basic_auth:
      username: 'admin'
      password: 'Coffee'
    static_configs:
      - targets: ["localhost:9090"]
About exporters
Most official exporters follow the same syntax and can even reuse the same configuration file.
On each machine with an exporter, I will create the directory /etc/exporters/web and create the file web.yml with the following content:
basic_auth_users:
  prom: $2b$12$W1jWulWeeF2LECdJMZc2G.i5fvJGSl5CE8F6Flz3tW4Uz7yBdUWZ.
I will then use the credentials prom and Coffee to log in.
Just like Prometheus, you need to add the --web.config.file=/etc/exporters/web/web.yml argument to the startup arguments of the exporter. On Alpine systems, you need to modify the /etc/conf.d/node-exporter file as shown below:
# /etc/conf.d/node-exporter

# Custom arguments can be specified like:
#
# ARGS="--web.listen-address=':9100'"

ARGS="--web.config.file=/etc/exporters/web/web.yml"
If you are using a systemd service, you will need to modify the /etc/default/prometheus-node-exporter file:
# Set the command-line arguments to pass to the server.
# Due to shell scaping, to pass backslashes for regexes, you need to double
# them (\\d for \d). If running under systemd, you need to double them again
# (\\\\d to mean \d), and escape newlines too.
ARGS="--web.config.file=/etc/exporters/web/web.yml"
Warning
Attention, I have noticed that depending on the version of your exporter, the argument –web.config.file may not be available. In this case, you will need to use the argument –web.config.
For Node-Exporter 1.6.1:
ARGS="--web.config.file=/etc/exporters/web/web.yml"
For Node-Exporter 1.3.1:
ARGS="--web.config=/etc/exporters/web/web.yml"
After restarting the exporter, you need to log in with the credentials prom ; Coffee.
  - job_name: "node"
    basic_auth:
      username: 'prom'
      password: 'Coffee'
    static_configs:
      - targets: ["localhost:9100"]
      - targets: ["dhcp.prometheus.home:9100"]
      - targets: ["bot.prometheus.home:9100"]
      - targets: ["proxmox.prometheus.home:9100"]
    relabel_configs:
      - source_labels: [__address__]
        regex: '(.*):[0-9]+'
        replacement: '${1}'
        target_label: instance
Enable TLS Encryption
In my homelab, I use MKCert to generate TLS certificates and certification authorities that will be added to the machines on my network.
Installing MKCert
MKCert is available in the official repositories of most Linux distributions.
apt install mkcert
apk add mkcert
yum install mkcert
Generate a Certification Authority
In order for the certificates to be considered valid by Prometheus, the Certification Authority needs to be added to the trust store of our host.
mkcert -install
Created a new local CA 💥
The local CA is now installed in the system trust store! ⚡️
It is possible to copy our CA to add it to other machines:
mkcert -CAROOT
/root/.local/share/mkcert
Generate a certificate
We have two options:
- Generate a certificate for each exporter.
- Generate a wildcard certificate for all exporters.
I have chosen the first option (more secure and realistic in a production environment).
for subdomain in dhcp proxmox server bot; do mkcert "${subdomain}.prometheus.home" ; done
Each certificate will be generated in the current directory.
prometheus:~/certs# ls -l
total 24
-rw-------    1 root     root          1708 Oct  8 07:52 dhcp.prometheus.home-key.pem
-rw-r--r--    1 root     root          1472 Oct  8 07:52 dhcp.prometheus.home.pem
-rw-------    1 root     root          1704 Oct  8 07:52 proxmox.prometheus.home-key.pem
-rw-r--r--    1 root     root          1476 Oct  8 07:52 proxmox.prometheus.home.pem
-rw-------    1 root     root          1704 Oct  8 07:52 server.prometheus.home-key.pem
-rw-r--r--    1 root     root          1472 Oct  8 07:52 server.prometheus.home.pem
Install a certificate
Add a certificate to an exporter
To install a certificate, I will create the directory /etc/exporters/certs and copy the certificates into it.
mkdir -p /etc/exporters/certs
mv *-key.pem /etc/exporters/certs/key.pem
mv *.home.pem /etc/exporters/certs/cert.pem
chown -R prometheus:prometheus /etc/exporters/certs
Now, I can edit the file /etc/exporters/web/web.yml (already created during the step adding basic_auth) to provide the paths to the certificates.
basic_auth_users:
  prom: $2b$12$W1jWulWeeF2LECdJMZc2G.i5fvJGSl5CE8F6Flz3tW4Uz7yBdUWZ.
tls_server_config:
  cert_file: /etc/exporters/certs/cert.pem
  key_file: /etc/exporters/certs/key.pem
The argument --web.config.file=/etc/exporters/web/web.yml is already present in the exporter’s startup command if you followed the Enable basic_auth authentication section.
After restarting the exporter, I can attempt access via HTTPS:
curl https://server.prometheus.home:9100 -u "prom:Coffee" -o /dev/null -v
I can see that the connection is indeed encrypted:
* SSL connection using TLSv1.3 / TLS_CHACHA20_POLY1305_SHA256
* ALPN: server accepted h2
* Server certificate:
*  subject: O=mkcert development certificate; OU=root@prometheus
*  start date: Oct  8 05:52:53 2023 GMT
*  expire date: Jan  8 06:52:53 2026 GMT
*  subjectAltName: host "server.prometheus.home" matched cert's "server.prometheus.home"
*  issuer: O=mkcert development CA; OU=root@prometheus; CN=mkcert root@prometheus
*  SSL certificate verify ok.
Final step for Prometheus to connect to the exporter via HTTPS: add scheme: https to the exporters inventory.
  - job_name: "node"
    scheme: "https"
    basic_auth:
      username: 'prom'
      password: 'Coffee'
    static_configs:
      - targets: ["server.prometheus.home:9100"]
      - targets: ["dhcp.prometheus.home:9100"]
      - targets: ["bot.prometheus.home:9100"]
      - targets: ["proxmox.prometheus.home:9100"]
    relabel_configs:
      - source_labels: [__address__]
        regex: '(.*):[0-9]+'
        replacement: '${1}'
        target_label: instance
After restarting Prometheus, I can see that the metrics are successfully retrieved via HTTPS!
Add a certificate to Prometheus
In the file /etc/prometheus/web/web.yml (created in the step about basic_auth), I will add the paths to the certificates, just like for the exporters.
basic_auth_users:
  admin: $2b$12$W1jWulWeeF2LECdJMZc2G.i5fvJGSl5CE8F6Flz3tW4Uz7yBdUWZ.
  ops: $2b$12$W1jWulWeeF2LECdJMZc2G.i5fvJGSl5CE8F6Flz3tW4Uz7yBdUWZ.
tls_server_config:
  cert_file: /etc/exporters/certs/cert.pem
  key_file: /etc/exporters/certs/key.pem
After restarting Prometheus, I can attempt access via HTTPS from my machine. The certificate is not considered valid since I haven’t added the certification authority to my machine.
➜ curl https://server.prometheus.home:9090
curl: (60) SSL certificate problem: unable to get local issuer certificate
More details here: https://curl.se/docs/sslcerts.html

curl failed to verify the legitimacy of the server and therefore could not
establish a secure connection to it. To learn more about this situation and
how to fix it, please visit the web page mentioned above.
I then retrieve the rootCA.pem and add it to my trust store (trust-store).
scp root@192.168.1.134:/root/.local/share/mkcert/rootCA.pem .
sudo cp ./rootCA.pem /usr/local/share/ca-certificates/mkcert.crt
sudo update-ca-certificates
Updating certificates in /etc/ssl/certs...
rehash: warning: skipping ca-certificates.crt,it does not contain exactly one certificate or CRL
1 added, 0 removed; done.
Running hooks in /etc/ca-certificates/update.d...
Adding debian:mkcert.pem
done.
done.
Now, I can connect to Prometheus via HTTPS:
curl https://server.prometheus.home:9090 -u "admin:Coffee"
<a href="/graph">Found</a>.
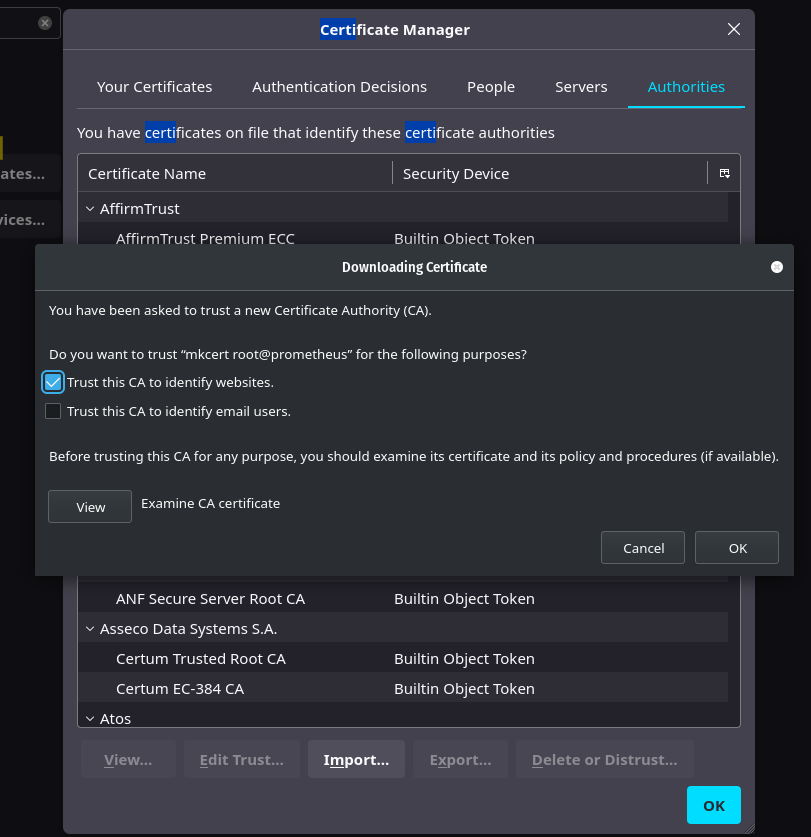
It is also possible to not add the certification authority to the trust system and only import it into our Firefox to be able to connect to Prometheus via HTTPS. (Settings -> Certificates -> View Certificates -> Authorities -> Import)
Metric Aggregation
It is common practice to create a Prometheus server per “Zone” or per “Cluster” (Kube) so that each environment is independent. However, having an overview of all these environments can quickly become complicated.
That’s why Prometheus offers a metric aggregation feature that allows you to retrieve data from multiple Prometheus servers and aggregate them on a main server.
In my case, I have:
- A Prometheus server in a Kubernetes cluster hosted on my Raspberry Pi.
- A second Prometheus server in a Kubernetes cluster on virtual machines (test cluster).
- A third Prometheus server that monitors hosts (physical servers, VMs, etc).
I want to retrieve metrics from the Prometheus servers in the Kubernetes clusters and aggregate them on the Prometheus server that monitors the hosts.
Warning
I recommend targeting the metrics you want to retrieve. Indeed, if you retrieve all the metrics from all the Prometheuses, you may saturate the memory of your main server.
  - job_name: 'cloudkube'
    scrape_interval: 15s
    honor_labels: true
    metrics_path: '/federate'
    params:
      'match[]':
        - '{job="kubernetes"}' # pour tout prendre: {job=~".*"}
    static_configs:
      - targets: ['192.168.128.51:30310']
    relabel_configs:
      - replacement: 'cloudkube'
        target_label: instance
Tip
honor_labels: true
This instruction allows you to manage conflicts when a federated server has metrics with the same labels as another server.
- If the value is true, the labels from the federated server are forcibly added (potentially overwriting existing labels).
- If the value is false, the metrics from the federated server will be renamed to exported_NAME. (“exported_job”, “exported_instance”, etc.)
Conclusion
I believe we have covered the main features of Prometheus. However, there are still many things that I haven’t discussed in this article (such as service discovery, administration API, long-term storage with Thanos, etc.), but I think this page is long enough.
Personally, I find Prometheus to be a very interesting product that offers incredible adaptability. The use of exporters is its strength, but also its main drawback: if a machine has multiple services, it will require a large number of exporters (and be complex to manage). I was also disappointed to find many community exporters that do not follow the same syntax (and configuration files) as the official exporters, making the use of TLS and basic_auth complex (or even impossible in some cases).
The Prometheus documentation is very accessible, although it does lack many examples for certain use cases.
Feel free to try Prometheus yourself to form your own opinion.
If you have positive feedback on this article and would like me to delve into certain points, please let me know so that we can explore these new topics together.