Loki from A to Y

Loki is an open-source log management system designed by Grafana Labs. It is known for being user-friendly and highly performant. Loki is designed to be used with Grafana using an equivalent to LogQL, a query language similar to Prometheus’s (to learn more about Prometheus, click here).
In this article, we will see how to install all the necessary components to use Loki and Promtail. We will also learn how to store logs on an object storage (Minio) to achieve high availability in a Loki cluster.
Loki Architecture
The architecture of Loki consists of three main components:
- Loki: the log storage server, it serves as the log database.
- Promtail: the log collection agent, it is responsible for collecting logs and sending them to Loki.
- Grafana: the user interface for visualizing the logs stored in Loki.

Tip
Promtail can be replaced by other log collection agents, such as Fluentd, Fluent Bit, or Logstash (we will only cover Promtail in this article).
One of the advantages of Loki is that it allows storing logs on object storage (such as S3, GCS, or Azure Blob Storage) or on local file systems.
We will start by using local storage, and then we will use Minio to store logs on object storage for high availability.
Why Minio?
Because using local storage does not provide high availability. Indeed, Loki does not support clustering with local storage (unless you hack something with NFS storage, but that’s not recommended).
Running Loki clustered is not possible with the filesystem store unless the filesystem is shared in some fashion (NFS for example). However using shared filesystems is likely going to be a bad experience with Loki just as it is for almost every other application.
Loki and Promtail Installation
For this initial installation, I will use the official Grafana repository:
mkdir -p /etc/apt/keyrings/
wget -q -O - https://apt.grafana.com/gpg.key | gpg --dearmor > /etc/apt/keyrings/grafana.gpg
echo "deb [signed-by=/etc/apt/keyrings/grafana.gpg] https://apt.grafana.com stable main" | tee /etc/apt/sources.list.d/grafana.list
Once the repositories are added, we can install Loki and Promtail using apt:
apt update
apt install -y promtail loki
To verify that Loki is functioning correctly, I can display the /metrics of Loki:
$ curl 192.168.1.73:3100/metrics -s | tail -n 5
ring_member_tokens_owned{name="scheduler"} 1
# HELP ring_member_tokens_to_own The number of tokens to own in the ring.
# TYPE ring_member_tokens_to_own gauge
ring_member_tokens_to_own{name="compactor"} 1
ring_member_tokens_to_own{name="scheduler"} 1
Note
What is /metrics?
It is the path used by Prometheus to retrieve the metrics exposed by Loki. To delve into the usage of this data, you can take a look at my article on Prometheus.
By default, Promtail will send logs to Loki via the URL http://localhost:3100/loki/api/v1/push using the /var/log/messages file. We can install logcli, a command-line utility to interact with Loki:
apt install logcli -y
Once installed, we can display the logs sent by Promtail:
$ logcli labels job
2024/02/07 07:09:56 http://localhost:3100/loki/api/v1/label/job/values?end=1707286196102901828&start=1707282596102901828
If, like me, you only see a URL in response, it means that Promtail has not yet sent any logs to Loki (empty response). This is because in my configuration, Promtail only monitors the /var/log/messages file… which does not exist on my system. I will replace this file with /var/log/dpkg.log to have logs to display and …
$ logcli labels job
2024/02/07 07:19:26 http://localhost:3100/loki/api/v1/label/job/values?end=1707286766300993936&start=1707283166300993936
varlogs
Victory! Promtail has successfully sent logs to Loki. I can also display them using my first LogQL query '{job="varlogs"}':
$ logcli query '{job="varlogs"}'
2024/02/07 07:21:59 http://localhost:3100/loki/api/v1/query_range?direction=BACKWARD&end=1707286919240803766&limit=30&query=%7Bjob%3D%22varlogs%22%7D&start=1707283319240803766
2024/02/07 07:21:59 Common labels: {filename="/var/log/dpkg.log", job="varlogs"}
2024-02-07T07:18:43+01:00 {} 2024-02-06 19:09:38 status installed logcli:amd64 2.9.4
2024-02-07T07:18:43+01:00 {} 2024-02-06 19:09:38 status half-configured logcli:amd64 2.9.4
2024-02-07T07:18:43+01:00 {} 2024-02-06 19:09:38 status unpacked logcli:amd64 2.9.4
2024-02-07T07:18:43+01:00 {} 2024-02-06 19:09:38 configure logcli:amd64 2.9.4 <none>
2024-02-07T07:18:43+01:00 {} 2024-02-06 19:09:38 startup packages configure
2024-02-07T07:18:43+01:00 {} 2024-02-06 19:09:38 status unpacked logcli:amd64 2.9.4
2024-02-07T07:18:43+01:00 {} 2024-02-06 19:09:38 status half-installed logcli:amd64 2.9.4
2024-02-07T07:18:43+01:00 {} 2024-02-06 19:09:38 install logcli:amd64 <none> 2.9.4
2024-02-07T07:18:43+01:00 {} 2024-02-06 19:09:38 startup archives unpack
2024-02-07T07:18:43+01:00 {} 2024-02-06 18:30:11 status installed promtail:amd64 2.9.4
2024-02-07T07:18:43+01:00 {} 2024-02-06 18:30:09 status half-configured promtail:amd64 2.9.4
2024-02-07T07:18:43+01:00 {} 2024-02-06 18:30:09 status unpacked promtail:amd64 2.9.4
2024-02-07T07:18:43+01:00 {} 2024-02-06 18:30:09 configure promtail:amd64 2.9.4 <none>
2024-02-07T07:18:43+01:00 {} 2024-02-06 18:30:09 status installed loki:amd64 2.9.4
2024-02-07T07:18:43+01:00 {} 2024-02-06 18:30:08 status half-configured loki:amd64 2.9.4
2024-02-07T07:18:43+01:00 {} 2024-02-06 18:30:08 status unpacked loki:amd64 2.9.4
Install Grafana
Grafana is an open-source data visualization tool. It is often used to visualize Prometheus metrics, but it can also be used to visualize logs stored in Loki.
I install Grafana on a different server than the one hosting Loki. The Grafana repository is the same as Loki’s.
mkdir -p /etc/apt/keyrings/
wget -q -O - https://apt.grafana.com/gpg.key | gpg --dearmor > /etc/apt/keyrings/grafana.gpg
echo "deb [signed-by=/etc/apt/keyrings/grafana.gpg] https://apt.grafana.com stable main" | tee /etc/apt/sources.list.d/grafana.list
apt update
apt install -y grafana
systemctl enable --now grafana-server
By default, Grafana is available on port :3000. To access it, simply go to the URL http://<ip>:3000 and log in with the default credentials (admin/admin).
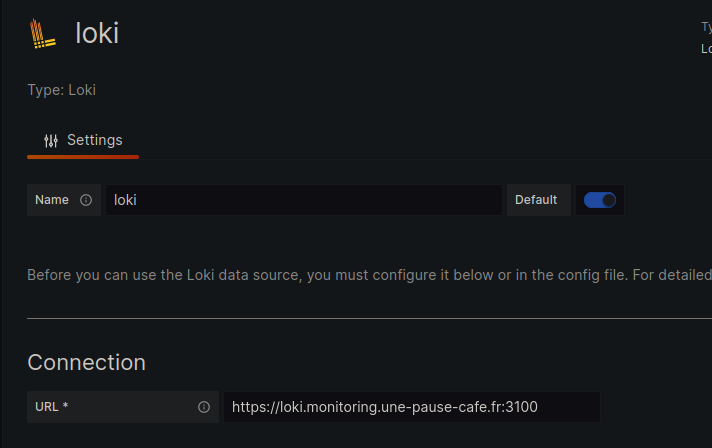
Next, we will add the Loki data source in the Configuration > Data Sources > Add data source menu.
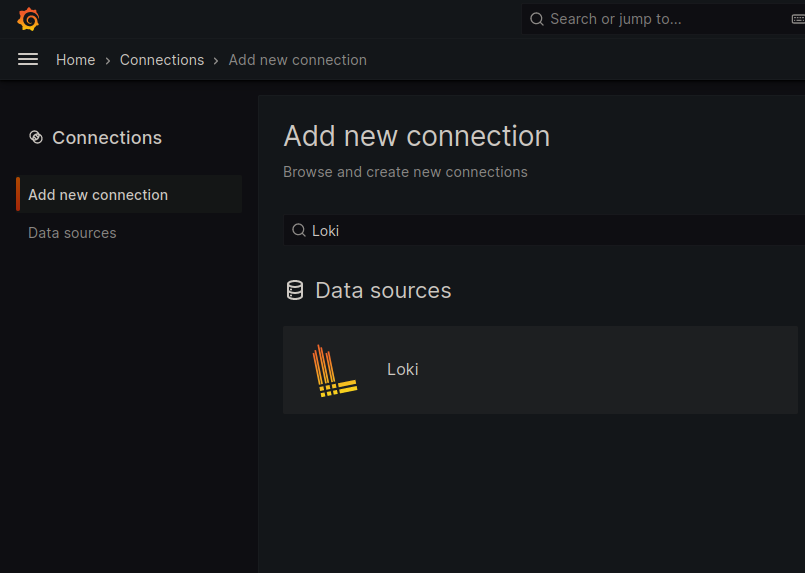
Apart from the Loki URI (which is http://loki-01:3100 in my case), I will leave the other fields as default.
Through the Grafana web interface, we can go to the Explore tab to visualize the logs stored in Loki.
The query form is the Query Builder, which allows us to build (and execute) queries for Loki. For example, I can select the varlogs job to display the contents of the /var/log/dpkg.log file on the loki machine.
LogQL
Introduction to LogQL
LogQL is a query language specifically designed for querying and filtering logs in Loki. It allows users to extract relevant data from large sets of logs efficiently.
Basic Principles of LogQL
Log Selection:
- Use the
{}clause to select the logs from which you want to extract data. For example,{job="nginx"}selects all logs coming from the job “nginx”. If multiple jobs have the same namenginx, you can add precision to your query by providing other labels ({job="nginx", node="nginx-server-01"})
- Use the
Filtering Logs:
- Use logical operators such as
==,!=,=~,!~to filter logs based on specific criteria. For example,{job="nginx"} |~ "error"selects logs from the job “nginx” that contain the word “error”.
- Use logical operators such as
Results Aggregation:
- Use aggregation functions like
sum(),count(),min(),max(), etc., to aggregate the results of the selected logs. For example,{job="nginx"} |~ "error" | count()will count the total number of logs containing the word “error” from the job “nginx”.
- Use aggregation functions like
Limiting Results:
- Use the
| limit Xclause to limit the number of results returned by your query. For example,{job="nginx"} |~ "error" | limit 10will return the first 10 logs containing the word “error” from the job “nginx”.
- Use the
Before proceeding further, I will secure the communication between Grafana and Loki using a certificate.
TLS Encryption
To secure the communication between Grafana and Loki, I will use a certificate validated by a local certification authority. In my lab, I am using mkcert, a tool that allows me to generate certificates using a certification authority that I can install on my machines.
MKCert Installation
MKCert is available in the official repositories of most Linux distributions.
apt install mkcert
apk add mkcert
yum install mkcert
nix-env -i mkcert
Generate a Certification Authority
In order for the certificates to be considered valid by Grafana/Loki, the Certification Authority needs to be added to the trust store of our host.
$ mkcert -install
Created a new local CA 💥
The local CA is now installed in the system trust store! ⚡️
It is possible to copy our CA to add it to other machines (so that the certificates are considered valid by these machines).
$ mkcert -CAROOT
/home/quentinj/.local/share/mkcert
The public key of this certification authority must be added to the Grafana machine (so that it accepts certificates signed by this authority).
$ scp $(mkcert -CAROOT)/rootCA.pem grafana.monitoring.une-pause-cafe.fr:/usr/local/share/ca-certificates/mkcert.crt
$ ssh grafana.monitoring.une-pause-cafe.fr sudo update-ca-certificates
Updating certificates in /etc/ssl/certs...
rehash: warning: skipping ca-certificates.crt,it does not contain exactly one certificate or CRL
1 added, 0 removed; done.
Running hooks in /etc/ca-certificates/update.d...
done.
Generate a certificate for Loki
On my local machine (having generated the certification authority), I will generate a certificate for Loki:
mkcert -cert-file loki-01.monitoring.une-pause-cafe.fr.crt -key-file loki-01.monitoring.une-pause-cafe.fr.key loki-01.monitoring.une-pause-cafe.fr loki-01
I obtain two files, loki-01.monitoring.une-pause-cafe.fr.crt and loki-01.monitoring.une-pause-cafe.fr.key, which are respectively the valid certificate and private key for:
loki-01.monitoring.une-pause-cafe.frloki-01
On the loki-01 machine, I will move these files to /etc/loki/ssl (which I created using mkdir -p /etc/loki/ssl):
scp loki-01.monitoring.une-pause-cafe.fr.crt loki-01.monitoring.une-pause-cafe.fr.key loki-01.monitoring.une-pause-cafe.fr:/etc/loki/ssl
Next, I will modify the Loki configuration file to instruct it to use these certificates:
server:
  http_listen_port: 3100
  http_tls_config: # <---- Ajout de cette section
    cert_file: /etc/loki/ssl/loki-01.monitoring.une-pause-cafe.fr.crt # <---- Certificat
    key_file: /etc/loki/ssl/loki-01.monitoring.une-pause-cafe.fr.key  # <---- Clé privée
  # [...]
After restarting Loki, I can verify that the encryption is in place using curl:
$ curl -I https://loki-01.monitoring.une-pause-cafe.fr:3100/metrics
HTTP/2 200
content-type: text/plain; version=0.0.4; charset=utf-8
[...]
No errors, the encryption is in place!
⚠️ This certificate must be recognized by the machines that will connect to Loki (i.e., each Promtail agent).
I also take this opportunity to add https to the Loki URL in Grafana.
Generate a certificate for Grafana
I will generate a certificate for Grafana in the same way as the one for Loki:
mkcert -cert-file grafana.monitoring.une-pause-cafe.fr.crt -key-file grafana.monitoring.une-pause-cafe.fr.key grafana.monitoring.une-pause-cafe.fr grafana
I create a directory /etc/grafana/ssl on the Grafana server and move the files grafana.monitoring.une-pause-cafe.fr.crt and grafana.monitoring.une-pause-cafe.fr.key into it.
scp grafana.monitoring.une-pause-cafe.fr.crt grafana.monitoring.une-pause-cafe.fr.key grafana.monitoring.une-pause-cafe.fr:/etc/grafana/ssl
I ensure that the certificates have the appropriate permissions:
chmod 600 /etc/grafana/ssl/*
chown grafana:grafana /etc/grafana/ssl/*
Next, I will modify the Grafana configuration file to instruct it to use these certificates (in /etc/grafana/grafana.ini):
# [...]
[server]
protocol = https
cert_file = /etc/grafana/ssl/grafana.monitoring.une-pause-cafe.fr.crt
cert_key = /etc/grafana/ssl/grafana.monitoring.une-pause-cafe.fr.key
# [... ]
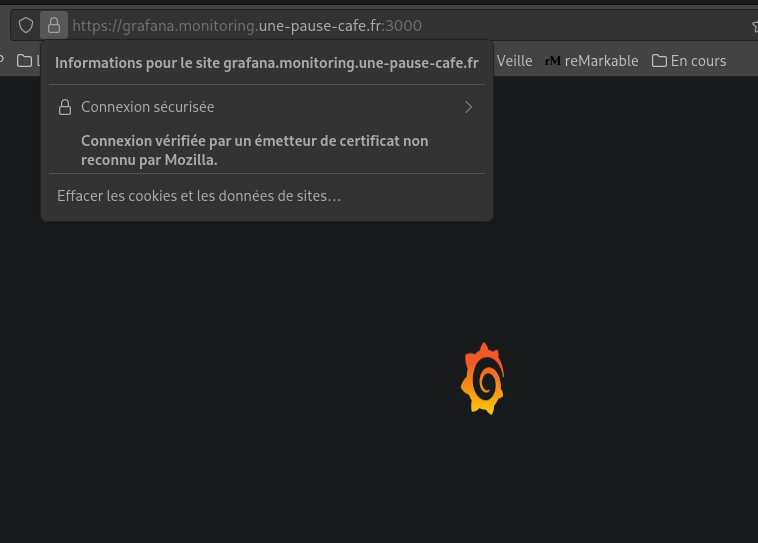
After a restart, I can verify that the encryption is in place using my browser:
Using S3
As we saw earlier, it is mandatory to use object storage for high availability with Loki. You can use cloud services like S3, GCS, or Azure Blob Storage, but I will use Minio to store the logs at home. So, I will install an instance of Minio, an open-source object storage server compatible with the S3 API.
The machine on which I will install Minio will be minio.monitoring.une-pause-cafe.fr.
Minio Installation
Minio can be installed using the .deb file available on the official website. I will download this file and install it using dpkg:
wget https://dl.min.io/server/minio/release/linux-amd64/minio_20240206213622.0.0_amd64.deb
dpkg -i minio_20240206213622.0.0_amd64.deb
Minio is installed, but we still need to configure it. To do this, I will create a file /etc/default/minio with the following content:
MINIO_VOLUMES=/mnt/data
MINIO_ROOT_USER="quentinj"
MINIO_ROOT_PASSWORD="ItsAlwaysTimeForCoffee"
MINIO_OPTS="--console-address :9001"
I will also create the minio-user user (already used in the service installed via the deb) and give them permissions on the /mnt/data directory:
adduser --system --no-create-home --group minio-user
chown minio-user:minio-user /mnt/data
Next, I start the Minio service:
systemctl enable --now minio
The console address is accessible at the URL http://minio.monitoring.une-pause-cafe.fr:9001. I will log in with the credentials quentinj and ItsAlwaysTimeForCoffee.
First and foremost, I will create a pair of Access/Secret key (to authenticate myself on the API).
- Access key :
nxWo1sZ90TLasqUTydCs - Secret key :
pHV1oz2m3QtYihk2KuetaxF4xGDBUOFpYTxhzWYT
Setting up TLS for Minio
I will generate a wildcard certificate for Minio in the same way as for Loki and Grafana:
Info
A wildcard is a certificate that is valid for a domain and all its subdomains. In my case, the certificate will be valid for *.minio.monitoring.une-pause-cafe.fr.
mkcert -cert-file minio.monitoring.une-pause-cafe.fr.crt -key-file minio.monitoring.une-pause-cafe.fr.key minio.monitoring.une-pause-cafe.fr '*.minio.monitoring.une-pause-cafe.fr' minio
Why a wildcard certificate?
Because when using the S3 API, we add the bucket name as a subdomain in the URL. For example, to access the loki bucket, we use the URL https://loki.minio.monitoring.une-pause-cafe.fr:9000. If the certificate is only valid for minio.monitoring.une-pause-cafe.fr, the S3 client will display a certificate error.
I create a directory /opt/minio/certs on the Minio machine and move the files minio.monitoring.une-pause-cafe.fr.crt and minio.monitoring.une-pause-cafe.fr.key into it.
scp minio.monitoring.une-pause-cafe.fr.crt minio.monitoring.une-pause-cafe.fr.key minio.monitoring.une-pause-cafe.fr:/opt/minio/certs
I also need to rename these files to private.key and public.crt:
mv /opt/minio/certs/minio.monitoring.une-pause-cafe.fr.crt /opt/minio/certs/public.crt
mv /opt/minio/certs/minio.monitoring.une-pause-cafe.fr.key /opt/minio/certs/private.key
I ensure that only the user ‘minio-user’ has access to these files:
chown minio-user:minio-user /opt/minio/certs/*
chmod 600 /opt/minio/certs/*
I edit the file /etc/default/minio to add the path to the certificates:
MINIO_VOLUMES=/mnt/data
MINIO_ROOT_USER="quentinj"
MINIO_ROOT_PASSWORD="ItsAlwaysTimeForCoffee"
MINIO_OPTS="--console-address :9001 --certs-dir /opt/minio/certs"
A quick systemctl restart minio and I can access the console securely!
$ curl -I https://minio.monitoring.une-pause-cafe.fr:9001
HTTP/2 200
accept-ranges: bytes
content-security-policy: default-src 'self' 'unsafe-eval' 'unsafe-inline';
content-type: text/html
last-modified: Thu, 08 Feb 2024 18:04:41 GMT
referrer-policy: strict-origin-when-cross-origin
server: MinIO Console
x-content-type-options: nosniff
x-frame-options: DENY
x-xss-protection: 1; mode=block
content-length: 1310
Create a bucket for Loki (with MC)
MC is a command-line client for Minio. It allows us to manipulate our Minio instance in a simple and efficient way. We will use it to create our bucket for Loki.
I install it on my local machine by downloading the binary:
wget https://dl.min.io/client/mc/release/linux-amd64/mc
chmod +x mc
sudo mv mc /usr/local/bin
Next, I will configure MC to connect to my Minio instance using the keys I generated earlier:
$ mc alias set homelab-monitoring/ https://minio.monitoring.une-pause-cafe.fr:9000 nxWo1sZ90TLasqUTydCs "pHV1oz2m3QtYihk2KuetaxF4xGDBUOFpYTxhzWYT"
Added `homelab-monitoring` successfully.
Warning
- ⚠️ Attention, the port used for
mcis:9000and not:9001. - It is also possible to use the same credentials as those used for the S3 API (in my case,
quentinjandItsAlwaysTimeForCoffee), but I recommend creating specific credentials for each service.
Next, I will create a bucket for Loki:
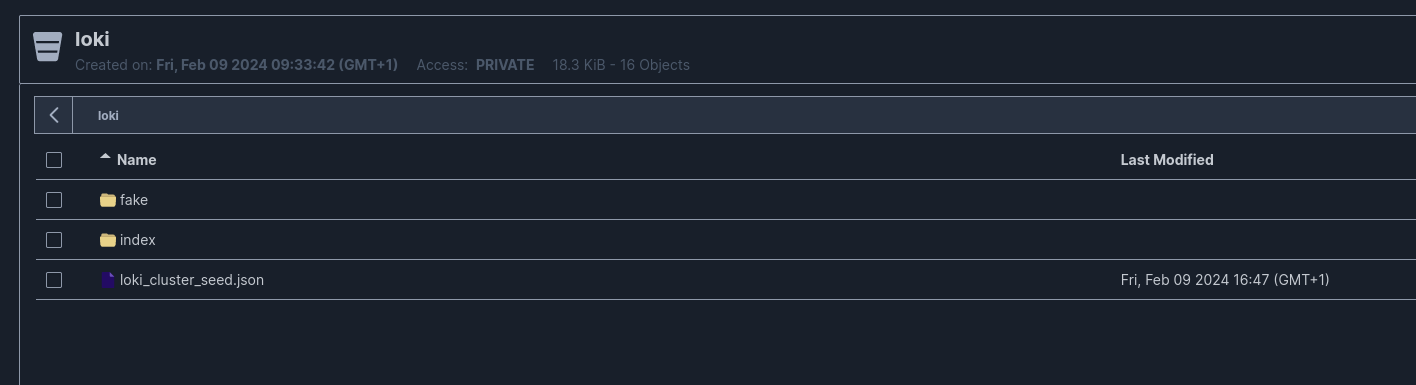
$ mc mb homelab-monitoring/loki
Bucket created successfully `homelab-monitoring/loki`.
Configure Loki to use an S3
I will modify the Loki configuration file to indicate the use of Minio as an object storage for log persistence.
auth_enabled: false

server:
  http_listen_port: 3100
  http_tls_config:
    cert_file: /etc/loki/ssl/loki-01.monitoring.une-pause-cafe.fr.crt
    key_file: /etc/loki/ssl/loki-01.monitoring.une-pause-cafe.fr.key

ingester:
  wal:
    enabled: true
    dir: /tmp/loki/wal
  chunk_idle_period: 5m
  chunk_retain_period: 30s
  chunk_block_size: 262144
  chunk_encoding: snappy

compactor:
  working_directory: /tmp/loki/compactor
  shared_store: s3
  compaction_interval: 5m
  retention_enabled: true

schema_config:
  configs:
  - from: 2020-05-15
    store: boltdb-shipper
    object_store: s3
    schema: v11
    index:
      prefix: index_
      period: 24h

common:
  replication_factor: 1
  path_prefix: /tmp/loki

storage_config:
 boltdb_shipper:
   active_index_directory: /tmp/loki/index
   cache_ttl: 24h
   cache_location: /tmp/loki/index_cache
   resync_interval: 5s
   shared_store: s3
 aws:
   s3: "https://nxWo1sZ90TLasqUTydCs:pHV1oz2m3QtYihk2KuetaxF4xGDBUOFpYTxhzWYT@minio:9000/loki"
   s3forcepathstyle: true
   bucketnames: loki
   region: us-east-1
   access_key_id: "nxWo1sZ90TLasqUTydCs" # Le compactor a besoin de ces variables pour fonctionner
   secret_access_key: "pHV1oz2m3QtYihk2KuetaxF4xGDBUOFpYTxhzWYT"
   endpoint: "https://minio.monitoring.une-pause-cafe.fr:9000"
With this configuration, Loki will store its logs locally and the compactor will send them to Minio for persistent storage.
Info
The compactor is a component of Loki that is responsible for log compaction. It is necessary to keep Loki’s database size reasonable. It also handles log deduplication to save disk space.
Loki Cluster
Loki supports clustering, meaning it is possible to launch multiple instances of Loki for high availability. The official documentation explains that a production setup is done in Kubernetes, but I will try to do it on my virtual machines.
The cluster nodes will communicate via a Gossip Ring, a communication protocol allowing each node to share information with the others.
Info
As seen earlier, it is necessary to use object storage for log persistence, as local storage does not support clustering. Therefore, using object storage was mandatory for the continuation of this article.

I will install Loki on two other machines, loki-02.monitoring.une-pause-cafe.fr and loki-03.monitoring.une-pause-cafe.fr to have a cluster of three nodes.
Here is the configuration file I used for the nodes (excluding the certificates to be replaced):
auth_enabled: false

server:
  http_listen_port: 3100
  http_tls_config:
    cert_file: /etc/loki/ssl/loki-01.monitoring.une-pause-cafe.fr.crt # <---- Certificate to replace
    key_file: /etc/loki/ssl/loki-01.monitoring.une-pause-cafe.fr.key  # <---- Private key to replace
  grpc_server_max_recv_msg_size: 20971520
  grpc_server_max_send_msg_size: 20971520

distributor:
  ring:
    kvstore:
      store: memberlist

ingester:
  wal:
    enabled: true
    dir: /tmp/loki/wal
  lifecycler:
    ring:
      kvstore:
        store: memberlist
      replication_factor: 1
    final_sleep: 0s
  chunk_idle_period: 5m
  chunk_retain_period: 30s
  chunk_block_size: 262144
  chunk_encoding: snappy

compactor:
  working_directory: /tmp/loki/compactor
  shared_store: s3
  compaction_interval: 5m
  retention_enabled: true

memberlist:
  abort_if_cluster_join_fails: false
  bind_port: 7946
  join_members:
  - loki-01:7946
  - loki-02:7946
  - loki-03:7946
  max_join_backoff: 1m
  max_join_retries: 10
  min_join_backoff: 1s

schema_config:
  configs:
  - from: 2020-05-15
    store: boltdb-shipper
    object_store: s3
    schema: v11
    index:
      prefix: index_
      period: 24h

common:
  ring:
    instance_addr: 127.0.0.1
    kvstore:
      store: memberlist
  replication_factor: 3
  path_prefix: /tmp/loki

storage_config:
 boltdb_shipper:
   active_index_directory: /tmp/loki/index
   cache_ttl: 168h
   cache_location: /tmp/loki/index_cache
   resync_interval: 5s
   shared_store: s3
 aws:
   s3: "https://nxWo1sZ90TLasqUTydCs:pHV1oz2m3QtYihk2KuetaxF4xGDBUOFpYTxhzWYT@minio:9000/loki"
   s3forcepathstyle: true
   bucketnames: loki
   region: us-east-1 # <---- pour Minio, c'est la région par défaut
   access_key_id: "nxWo1sZ90TLasqUTydCs"
   secret_access_key: "pHV1oz2m3QtYihk2KuetaxF4xGDBUOFpYTxhzWYT"
   endpoint: "https://minio.monitoring.une-pause-cafe.fr:9000"
I will restart Loki on all three machines to make clustering effective.
févr. 10 09:38:31 loki-02 loki[2812]: level=info ts=2024-02-10T08:38:31.839709692Z caller=memberlist_client.go:592 msg="joining memberlist cluster succeeded" reached_nodes=2 elapsed_time=8.0811ms
On Loki-02, I can see that the node has successfully joined the cluster ⬆️ !
Do you know how we can check the cluster status? With PromQL on a Prometheus, of course (Since it’s for monitoring)!
Here is the configuration I added to my Prometheus configuration file to scrape Loki metrics:
  - job_name: loki
    scrape_interval: 5s
    scheme: "https"
    scrape_timeout: 5s
    static_configs:
      - targets: ['loki-01.monitoring.une-pause-cafe.fr:3100', 'loki-02.monitoring.une-pause-cafe.fr:3100', 'loki-03.monitoring.une-pause-cafe.fr:3100']
The cluster status can be displayed with the following query:
{__name__=~"loki_memberlist_.*cluster.*"}
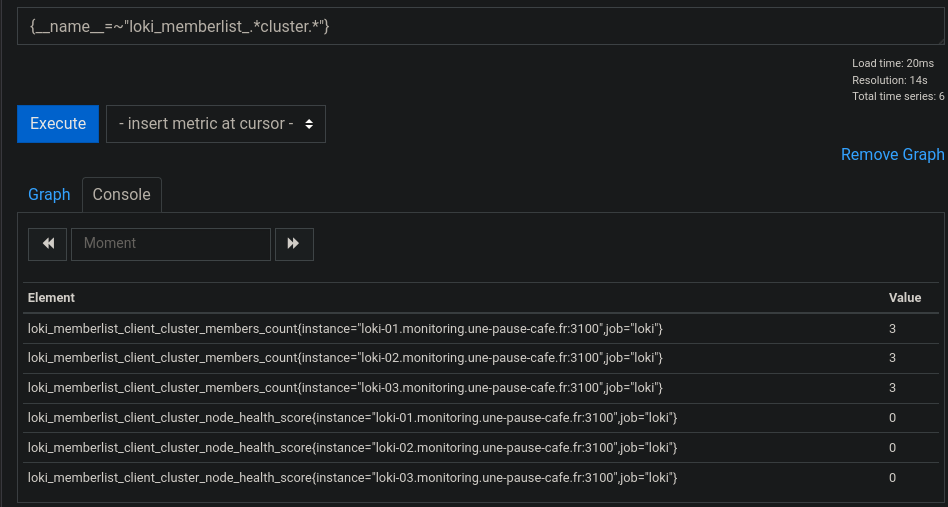
(a node_health of 0 means the node is Healthy.)
But what does this actually change for now? Promtail still sends its logs to Loki-01, which stores them on Minio.
The next step is to set up a VIP (Virtual IP) for Promtail to send its logs to, which will distribute them to one of the nodes in the cluster. But before that, we can already check the proper functioning of the clustering by redirecting Promtail requests to loki-02, then querying loki-01 and loki-02 to see if the logs are accessible on both nodes.
$ logcli query '{job="nginx"} |= `UneTasseDeCafe`' --addr="https://loki-01.monitoring.une-pause-cafe.fr:3100"
2024/02/13 18:22:34 https://loki-01.monitoring.une-pause-cafe.fr:3100/loki/api/v1/query_range?direction=BACKWARD&end=1707844954515007056&limit=30&query=%7Bjob%3D%22nginx%22%7D+%7C%3D+%60UneTasseDeCafe%60&start=1707841354515007056
2024/02/13 18:22:34 Common labels: {filename="/var/log/nginx/access.log", job="nginx", node="grafana"}
2024-02-13T18:18:48+01:00 {} 100.64.0.13 - - [13/Feb/2024:18:18:48 +0100] "GET /UneTasseDeCafe HTTP/1.1" 404 125 "-" "Mozilla/5.0 (X11; Linux x86_64; rv:122.0) Gecko/20100101 Firefox/122.0"
$ logcli query '{job="nginx"} |= `UneTasseDeCafe`' --addr="https://loki-02.monitoring.une-pause-cafe.fr:3100"
2024/02/13 18:22:38 https://loki-02.monitoring.une-pause-cafe.fr:3100/loki/api/v1/query_range?direction=BACKWARD&end=1707844958725211857&limit=30&query=%7Bjob%3D%22nginx%22%7D+%7C%3D+%60UneTasseDeCafe%60&start=1707841358725211857
2024/02/13 18:22:39 Common labels: {filename="/var/log/nginx/access.log", job="nginx", node="grafana"}
2024-02-13T18:18:48+01:00 {} 100.64.0.13 - - [13/Feb/2024:18:18:48 +0100] "GET /UneTasseDeCafe HTTP/1.1" 404 125 "-" "Mozilla/5.0 (X11; Linux x86_64; rv:122.0) Gecko/20100101 Firefox/122.0"
The same data is well present on both nodes of the cluster!

Now, let’s move on to setting up the VIP.
Setting up the VIP
The VIP is a single entry point for clients. It will distribute incoming requests to one of the functional nodes in the cluster. I am using keepalived to set up the VIP.
On each node of the cluster, I will install keepalived:
apt install keepalived -y
Next, I will create a file /etc/keepalived/keepalived.conf on loki-01 with the following content:
vrrp_instance VI_1 {
        state MASTER
        interface ens18
        virtual_router_id 51
        priority 255
        advert_int 1
        authentication {
              auth_type PASS
              auth_pass CoffeeAddict
        }
        virtual_ipaddress {
              192.168.1.5/24
        }
}
Warning
⚠️ Attention, the ens18 interface is specific to my machine. You should replace ens18 with the network interface of your machine.
The use of CoffeeAddict as the auth_pass is also an example. You should replace it with a secure password (and use the same password on all nodes) or use a different authentication method.
On the other nodes, I will create the same file, but with state BACKUP and a lower priority.
vrrp_instance VI_1 {
        state BACKUP
        interface ens18
        virtual_router_id 51
        priority 254
        advert_int 1
        authentication {
              auth_type PASS
              auth_pass CoffeeAddict
        }
        virtual_ipaddress {
              192.168.1.5/24
        }
}
Next, I will start the keepalived service on all three machines:
systemctl enable --now keepalived
The IP 192.168.1.5 is now redirected to loki-01. If this node fails, the VIP will be redirected to another machine in the cluster.
I will create the DNS entry loki.monitoring.une-pause-cafe.fr to point to this VIP and create the certificate for this address.
$ mkcert -cert-file loki.monitoring.une-pause-cafe.fr.crt -key-file loki.monitoring.une-pause-cafe.fr.key loki.monitoring.une-pause-cafe.fr loki
I will then move these files to /etc/loki/ssl on loki-01 and copy them to the other nodes.
scp loki.monitoring.une-pause-cafe.fr.crt loki.monitoring.une-pause-cafe.fr.key loki-01.monitoring.une-pause-cafe.fr:/etc/loki/ssl
scp loki.monitoring.une-pause-cafe.fr.crt loki.monitoring.une-pause-cafe.fr.key loki-02.monitoring.une-pause-cafe.fr:/etc/loki/ssl
scp loki.monitoring.une-pause-cafe.fr.crt loki.monitoring.une-pause-cafe.fr.key loki-03.monitoring.une-pause-cafe.fr:/etc/loki/ssl
ssh loki-01.monitoring.une-pause-cafe.fr "chown loki /etc/loki/ssl/*"
ssh loki-02.monitoring.une-pause-cafe.fr "chown loki /etc/loki/ssl/*"
ssh loki-03.monitoring.une-pause-cafe.fr "chown loki /etc/loki/ssl/*"
I will then modify the Loki configuration file to indicate the use of these certificates:
ssh loki-01.monitoring.une-pause-cafe.fr "sed -i 's/loki-0[0-9].monitoring.une-pause-cafe.fr/loki.monitoring.une-pause-cafe.fr/g' /etc/loki/config.yml"
ssh loki-02.monitoring.une-pause-cafe.fr "sed -i 's/loki-0[0-9].monitoring.une-pause-cafe.fr/loki.monitoring.une-pause-cafe.fr/g' /etc/loki/config.yml"
ssh loki-03.monitoring.une-pause-cafe.fr "sed -i 's/loki-0[0-9].monitoring.une-pause-cafe.fr/loki.monitoring.une-pause-cafe.fr/g' /etc/loki/config.yml"
I will restart the Loki service on all three machines to apply the changes.
ssh loki-01.monitoring.une-pause-cafe.fr "systemctl restart loki"
ssh loki-02.monitoring.une-pause-cafe.fr "systemctl restart loki"
ssh loki-03.monitoring.une-pause-cafe.fr "systemctl restart loki"
I will then modify the Promtail configuration file to indicate sending its logs to loki.monitoring.une-pause-cafe.fr:
clients:
- url: https://loki.monitoring.une-pause-cafe.fr:3100/loki/api/v1/push
# [...]
On Grafana, I modify the Loki data source to indicate the use of loki.monitoring.une-pause-cafe.fr as the URL.
Once everything is set up, I will verify that the logs are being sent to loki.monitoring.une-pause-cafe.fr and that the queries are properly distributed across the three nodes of the cluster.
$ logcli query '{job="nginx"} |= `UneTasseDeCafe`' --addr="https://loki.monitoring.une-pause-cafe.fr:3100"
# [...]
2024/02/13 21:27:51 Common labels: {filename="/var/log/nginx/access.log", job="nginx", node="grafana"}
2024-02-13T21:27:48+01:00 {} 100.64.0.1 - - [13/Feb/2024:21:27:48 +0100] "GET /?UneTasseDeCafe HTTP/1.1" 200 409 "-" "Mozilla/5.0 (X11; Linux x86_64; rv:121.0) Gecko/20100101 Firefox/121.0"
2024/02/13 21:27:51 https://loki.monitoring.une-pause-cafe.fr:3100/loki/api/v1/query_range?direction=BACKWARD&end=1707856068916047554&limit=30&query=%7Bjob%3D%22nginx%22%7D+%7C%3D+%60UneTasseDeCafe%60&start=1707852471375877575
Conclusion
We have seen how to set up a Loki cluster with object storage, a VIP, and TLS encryption. We have also seen how to monitor our cluster with Prometheus.
I had major difficulties setting up Loki clustering, mainly due to the documentation not being very clear on the subject and being heavily focused on Kubernetes. I struggled a bit to find the right configuration.
Loki is actually a much more powerful tool than I thought; the documentation presents parameters that can be very fine-grained according to our needs. I am happy with this lab; I have learned a lot about Loki that I hope to be able to reuse in the future.
I might tackle an installation of VictoriaLogs, an alternative to Loki that is more performance-oriented (Elastic also has a similar solution, but I am concerned about the resources required in a ‘minimal’ configuration).
Hoping you enjoyed this lab, I’ll see you soon for the next article!